Organic vs Paid Growth Channel Comparison
Organic vs paid growth channel comparison: First Page Sage B2B organic CAC $942 vs paid $1,907, why PPC can beat basic SEO, and the B2C flip.
Marketing budget allocation by company stage: SaaS Capital's 8% median, equity-backed +100% vs bootstrap, and why unit economics beat round-label tables.

TL;DR: Marketing budget allocation by company stage starts with peers, not a round-label myth. SaaS Capital’s 2026 survey of 1,000+ private B2B SaaS companies puts median marketing spend at 8% of ARR and selling costs at 15%. Equity-backed firms spend about 100% more on marketing than bootstrapped peers. Set the number with ARR band, capital structure, and LTV:CAC payback, not a Seed/Series A table copied from an agency blog.
Boards ask for marketing budget allocation by company stage as if Series A came with a stamped percentage. Agency posts answer with neat ladders: Seed 15-25%, Series A 12-18%, Series B 11-16%. Those bands are useful as gossip. They are not a public census.
The defensible path is narrower. Look at what private SaaS peers actually spend, adjust for whether you are buying growth with equity or protecting bootstrap cash, then cap the number with unit economics. SaaS Capital’s March 2026 survey of more than 1,000 private B2B SaaS companies puts median marketing at 8% of ARR and selling costs at 15% (SaaS Capital). Equity-backed companies spend about 100% more on marketing than bootstrapped peers in that same study. Gartner’s large-company CMO sample sits near 7.7% of revenue, a mature floor, not a Seed target (Gartner via BusinessWire).
Key takeaways:
Marketing budget allocation by company stage is the practice of setting marketing spend (usually as a percent of ARR or of capital raised) using peers at a similar scale and funding posture, then adjusting for growth goal and unit economics.
It is not the same as brand-versus-performance mix inside that envelope (content marketing vs performance marketing). It is not your GTM motion choice (PLG, SLG, hybrid, partner-led), though motion changes what the dollars buy (go-to-market strategy frameworks compared). And it is not “sales and marketing combined” unless you say so. SaaS Capital separates selling costs (median 15% of ARR) from marketing (median 8%) for a reason (SaaS Capital).
For pre-revenue teams, percent of ARR is undefined. Then the honest denominator is runway or raise, and the job is learning, not scaling. Once ARR exists, percent of ARR becomes comparable across peers.
Wrong envelopes create fake efficiency or fake growth. Bootstrap companies that copy VC marketing intensity burn out. Equity-backed companies that copy Gartner’s 7.7% enterprise average underfund the motion they raised to buy.
Why this page earns space:
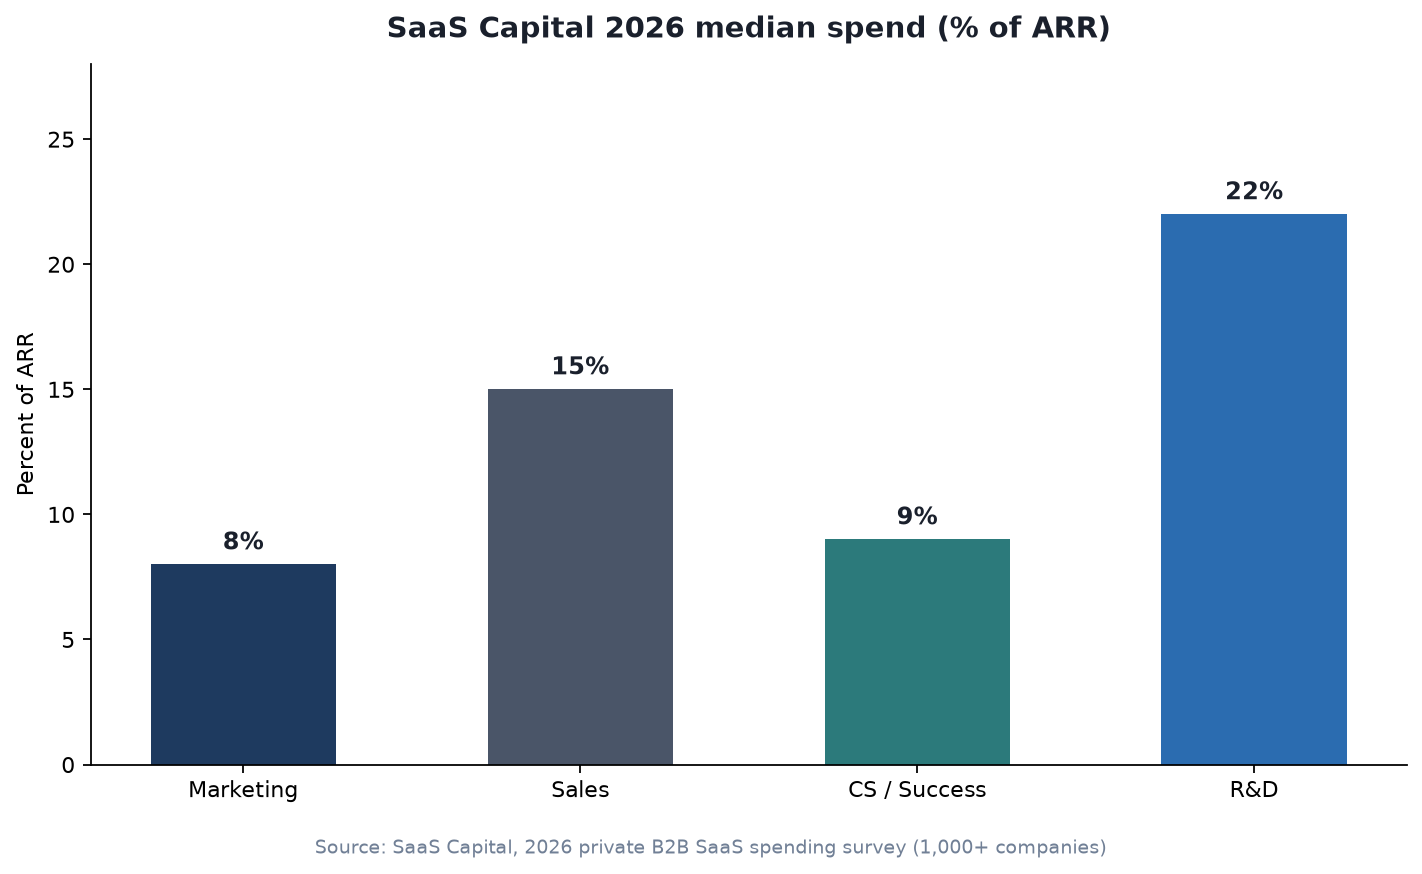
Source: SaaS Capital, 2026 Spending Benchmarks for Private B2B SaaS Companies (survey completed March 2026; 1,000+ respondents). https://www.saas-capital.com/blog-posts/spending-benchmarks-for-private-b2b-saas-companies/
Budgets change when ARR scale, capital source, and growth ambition change, not when someone updates the round name on PitchBook. Use three cuts: overall medians, capital structure, and an ARR-band example. Then apply unit-economics gates.
| Department | Median % of ARR (SaaS Capital 2026) |
|---|---|
| Marketing | 8% |
| Selling costs | 15% |
| Customer support / success | 9% |
| Research and development | 22% |
| General and administrative | 15% |
Source: SaaS Capital. These are medians across the sample, not prescriptions for every Seed company.
Equity-backed companies in the SaaS Capital sample spend about 100% more on marketing, 70% more on sales, and 100% more on customer success than bootstrapped peers. Total median spend sits near 101% of ARR for equity-backed vs 96% for bootstrapped. Profitability follows: 52% of equity-backed near breakeven or profitable vs 83% of bootstrapped (SaaS Capital; PDF summary).
That gap is the stage story agencies bury. Two companies at “$4M ARR” are not peers if one is buying share with a fresh raise and the other is living on cash from customers.
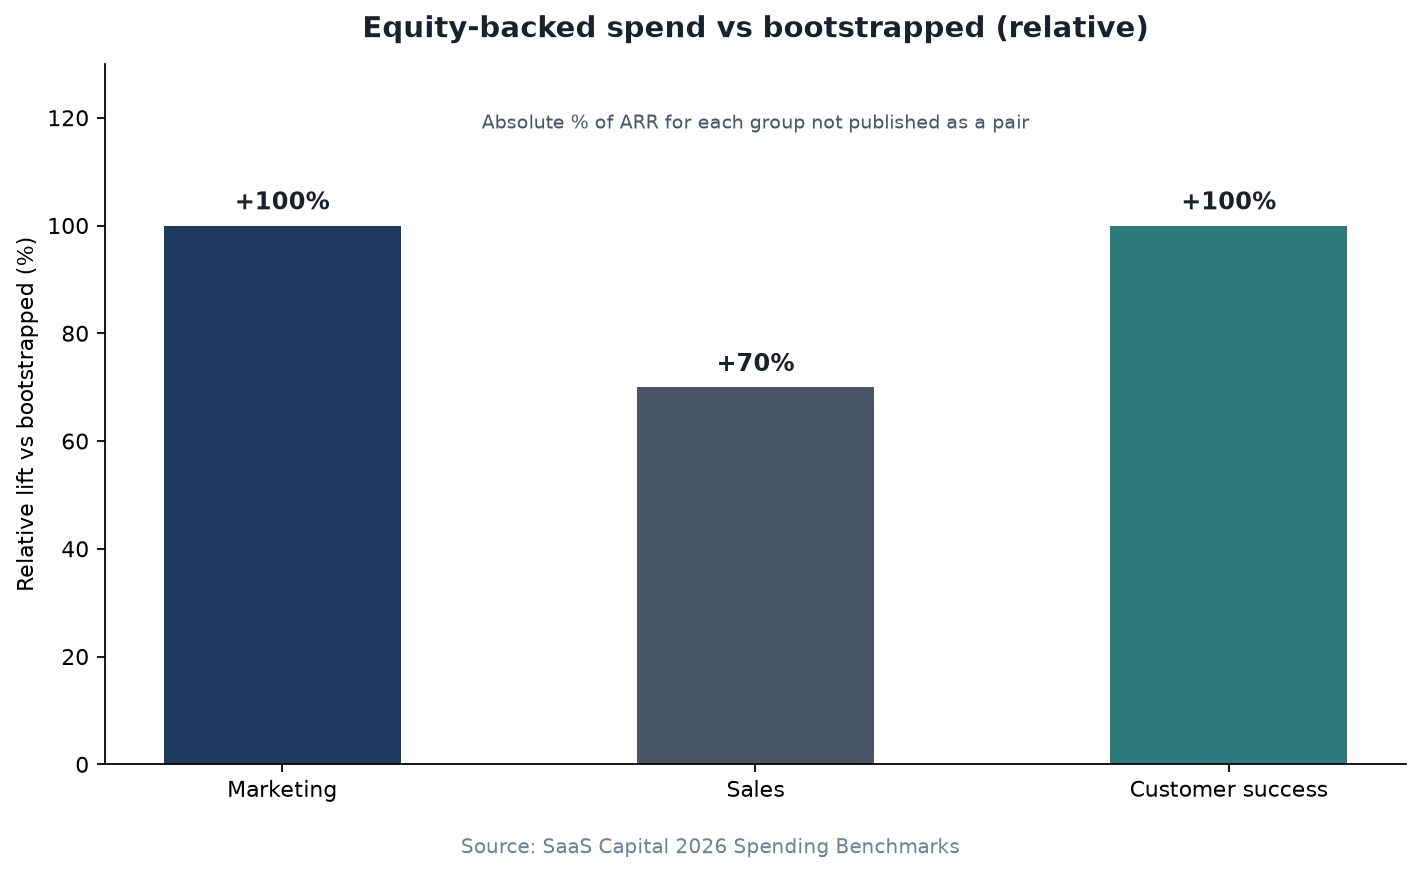
Source: SaaS Capital 2026 Spending Benchmarks (equity-backed vs bootstrapped relative differences). https://www.saas-capital.com/blog-posts/spending-benchmarks-for-private-b2b-saas-companies/
For a typical private B2B SaaS company at $3M-$5M ARR, SaaS Capital reports medians of 8% marketing, 12% selling, 10% CS/success, 24% R&D, and 15% G&A (SaaS Capital). At $4M ARR, 8% marketing is about $320K/year. That is a peer check, not a mandate. An equity-backed company chasing 25% growth may sit above it. A bootstrap company protecting margin may sit below it.
Seed / Series A / Series B percentage tables fill search results. They rarely publish a primary survey that measures marketing % of ARR by round with a disclosed sample. Until they do, treat those ladders as no public census. Prefer SaaS Capital’s ARR and funding cuts, then model your own pipeline math.
Once the envelope is set, mix is a second decision. Adobe and MMA Global find 57% of marketing budget going to performance among surveyed senior marketers, while only about 19% call their org performance-led (Marketing Week). Gartner’s large-CMO sample puts paid media at 30.6% of marketing budgets (BusinessWire / Gartner). Those figures answer “how do we split marketing,” not “how big is marketing.” Attribution and MMM decide whether the mix is lying (attribution models compared; marketing mix modeling basics).
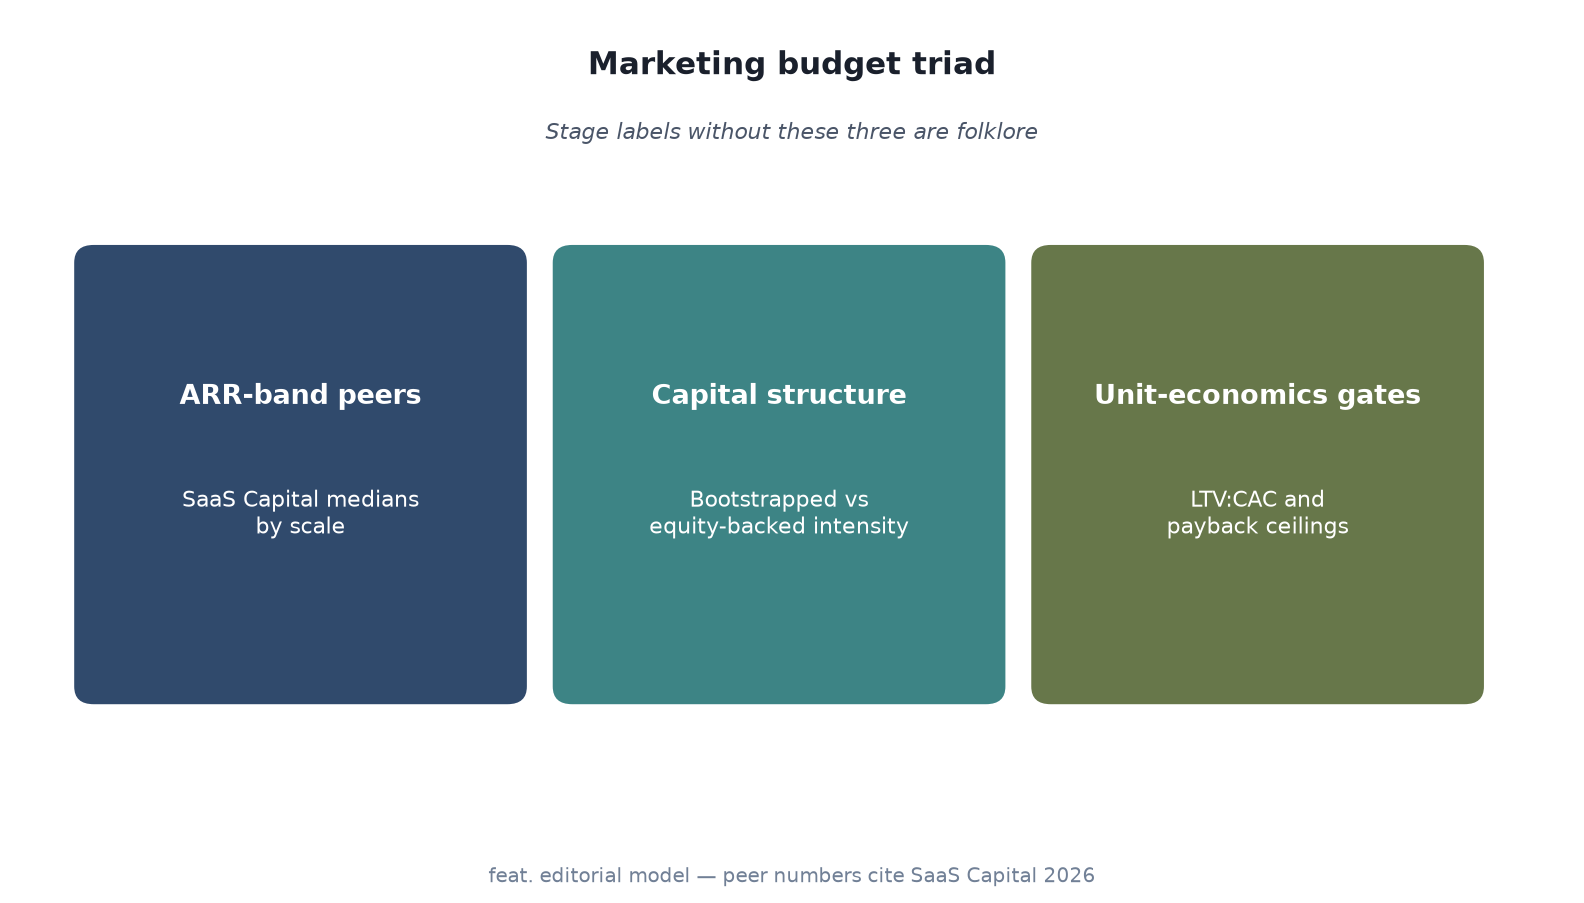
Source: feat. editorial budget triad for this article. Peer medians and capital-structure lifts from SaaS Capital 2026; unit-economics gates from Skok / Aleph×Benchmarkit.
Set the envelope before you argue about channels.
Q: What percent of ARR should go to marketing? A: SaaS Capital’s 2026 survey of more than 1,000 private B2B SaaS companies puts the median at 8% of ARR. Equity-backed growth companies often spend more; bootstrapped companies often spend less. Treat 8% as a peer check, then gate with LTV:CAC and payback.
Q: How does marketing budget change by company stage? A: Spend as a share of ARR usually compresses as organic channels and brand compound, but capital structure and growth targets matter more than the round name. Use ARR-band peers and bootstrapped-versus-equity cuts from primary surveys. Agency Seed/Series ladders are not a public census.
Q: How much do Series A startups spend on marketing? A: There is no single verified Series A census percentage. At $3M-$5M ARR, SaaS Capital shows median marketing still near 8% of ARR in its size cut, while equity-backed firms as a group spend about twice as much on marketing as bootstrapped peers. Model pipeline need and payback rather than copying a blog band.
Q: Should marketing and sales share one budget percentage? A: Usually no. SaaS Capital separates them: median marketing 8% of ARR and selling costs 15% of ARR in 2026. Combining them hides whether demand gen or headcount is the lever. Report both.
Q: Is Gartner’s 7.7% of revenue a good startup target? A: Not for early private SaaS. Gartner’s 2025 CMO sample is dominated by companies over $1B in revenue. Use 7.7% as a large-enterprise reference. Private SaaS medians from SaaS Capital are the better peer set for stage planning.
Marketing budget allocation by company stage is a peer-and-constraints problem. SaaS Capital’s 8% marketing median and equity-backed premium tell you where private companies actually sit. Gartner’s 7.7% reminds you what giant CMOs run. Unit economics decide whether your number is strategy or burn. Skip the fake precision of round-label tables until someone publishes a real census.
If distribution partners can carry part of acquisition through co-branded storefronts and a revenue split, start at feat..
Organic vs paid growth channel comparison: First Page Sage B2B organic CAC $942 vs paid $1,907, why PPC can beat basic SEO, and the B2C flip.
Marketing funnel benchmarks by stage and industry: First Page Sage Lead-to-MQL rates, channel gaps, and why B2B and ecommerce funnels differ.
Affiliate marketing for startups is an operating system—locks, cost, recruit, rates, tracking, first 100 sales, then diagnose a flat roster.