Performance Marketing KPI Benchmarks by Channel
Performance marketing KPI benchmarks by channel: WordStream search, Triple Whale Meta 1.88 vs Google 3.27 ROAS, Dreamdata LinkedIn 121%.
CAC vs LTV benchmarks by industry: Skok's 3:1 floor, Aleph's 4.1x SaaS median, First Page Sage industry ratios, and why payback months matter.

TL;DR: CAC vs LTV benchmarks by industry start with definitions, not a magic 3:1 slide. David Skok’s guidance treats LTV at least 3x CAC as a viability floor for recurring models, with CAC recovery often under 12 months. Aleph × Benchmarkit’s 2025 SaaS median is 4.1x. Industry tables only help after you match methodology and stage.
Boards still open the unit-economics page with “3:1.” Operators paste an industry table from a blog and declare victory. Both moves skip the hard part: what LTV means in your model, how CAC was loaded, and whether payback months will starve the company before the ratio looks pretty.
CAC vs LTV benchmarks by industry are useful when you treat them as reference distributions with footnotes, not as laws. The ratio answers whether a customer is worth more than they cost. Payback answers how fast you get the cash back. You need both.
Key takeaways:
CAC vs LTV is the comparison of what you spend to win a customer (customer acquisition cost) against the gross profit you expect from that customer over the relationship (lifetime value). The LTV:CAC ratio is LTV divided by CAC.
CAC is usually total sales and marketing cost in a period divided by new customers acquired in that period. Fully loaded CAC includes salaries, tools, creative, and agency fees, not only ad spend (Skok).
LTV is not “all revenue forever.” The useful version is contribution or gross-margin lifetime value: roughly average revenue per customer times gross margin, divided by churn (period matched). Aleph’s SaaS framing uses average annual revenue per customer times gross margin percent, divided by annual churn (Aleph). Skip the margin step and you will approve acquisition you cannot afford.
This page is about benchmarks and reading them. It is adjacent to how brands calculate influencer marketing ROI, which is a channel scorecard problem, and to recurring vs one-time affiliate commissions, which is how partner payout duration hits the same LTV math.
Wrong benchmarks create two expensive errors: cutting growth when you should spend, or pouring cash into a leaky cohort because a slide said 3:1.
Why the number fights back:
Read three layers in order: the classic floor, the current SaaS distribution, then industry tables with methodology attached. Never reverse that order.
David Skok’s For Entrepreneurs guidance treats micro-economics as LTV versus CAC. The rule of thumb is that LTV should be at least about 3x CAC for a viable SaaS or recurring-revenue model, and that startups should aim to recover CAC in under roughly 12 months because capital is expensive early (SaaS Metrics 2.0; Startup Killer). He also notes that many of the best SaaS businesses run higher than 3x (sometimes 7x to 8x) and recover CAC in about 5 to 7 months, while healthy companies can miss the guideline early and improve toward it (SaaS Metrics 2.0).
That is a floor-and-payback pair for recurring models. It is not a 2025 industry census. Treat “we hit 3:1” as “we cleared the classic gate,” not “we matched best-in-class.”
The 2026 Aleph × Benchmarkit SaaS & AI Performance Benchmarks report (published June 1, 2026) reports full-year 2025 actuals from 342 B2B SaaS and AI-native companies. CLTV:CAC figures use the 146 participants that reported the metric (Aleph; Benchmarkit PDF).
| Cut (CY-2025) | CLTV:CAC | Source |
|---|---|---|
| Bottom quartile | 1.1x | Aleph × Benchmarkit |
| Median | 4.1x | Aleph × Benchmarkit |
| Top quartile | 7.8x | Aleph × Benchmarkit |
| Horizontal SaaS median | 4.1x | Aleph |
| Vertical SaaS median | 5.6x | Aleph |
| Growing >50% YoY median | 7.2x | Aleph |
| Low-growth median | 3.2x | Aleph |
| >$100M ARR median | 8.0x | Aleph |
| $20M-$100M ARR median | ~3.1x | Aleph |
Aleph’s own reading: 3:1 remains the long-standing minimum, 4x to 5x is healthy, 7x+ is top-tier, and a ratio far above that can mean under-investment in growth. The median sat near 3.6x to 3.7x from 2022 through 2024 before the 4.1x print in 2025; the top quartile moved from 6.0x to 7.8x (Aleph).
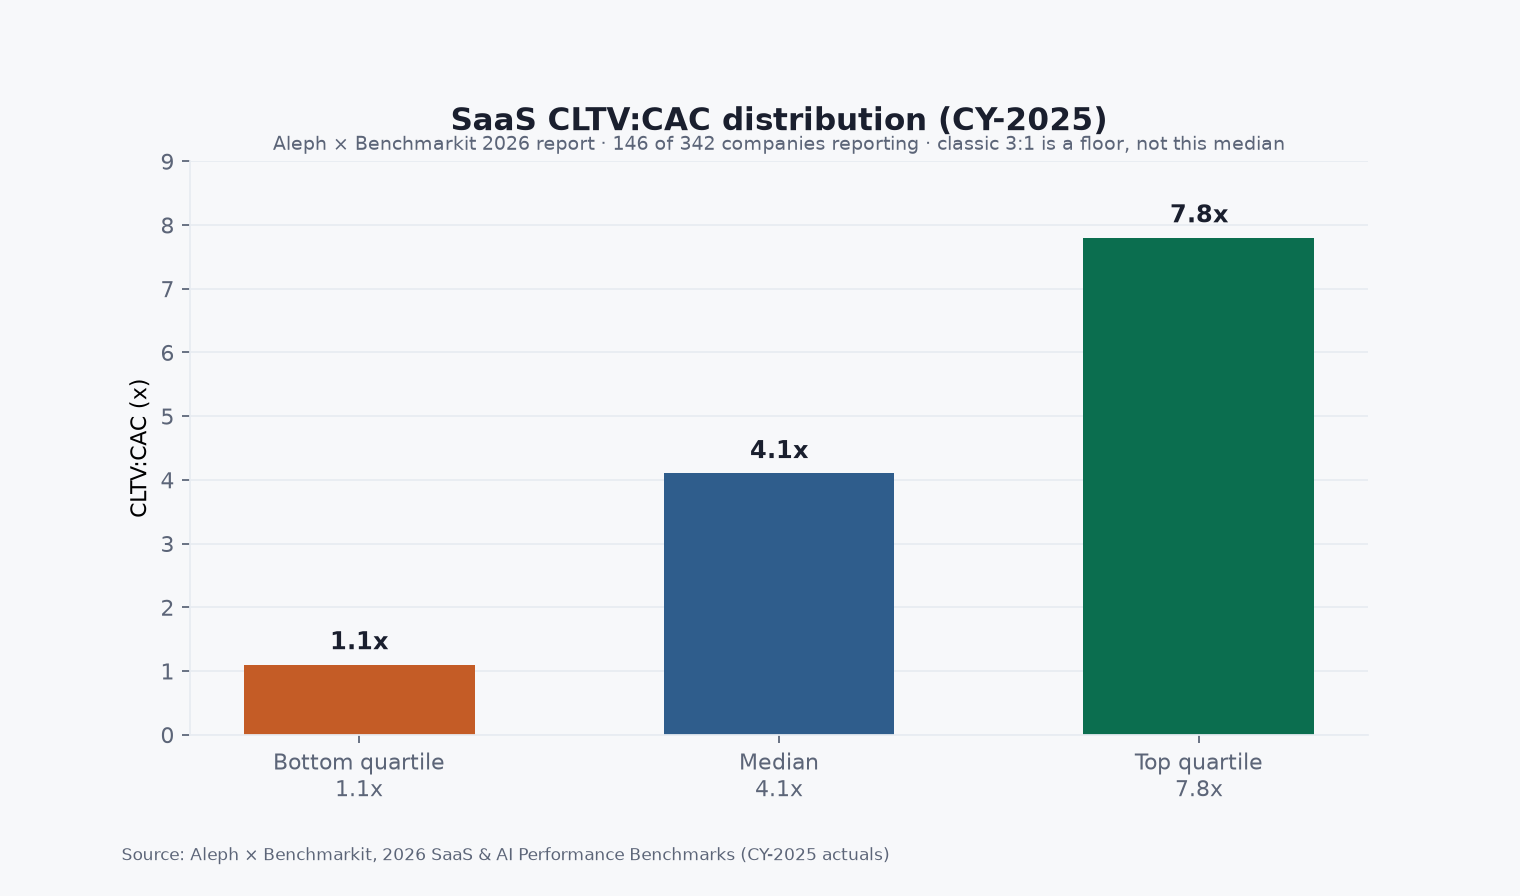
Source: Aleph × Benchmarkit, 2026 SaaS & AI Performance Benchmarks (CY-2025 actuals, n=146 reporters). https://www.getaleph.com/answers/cltv-cac-ratio-saas-2026
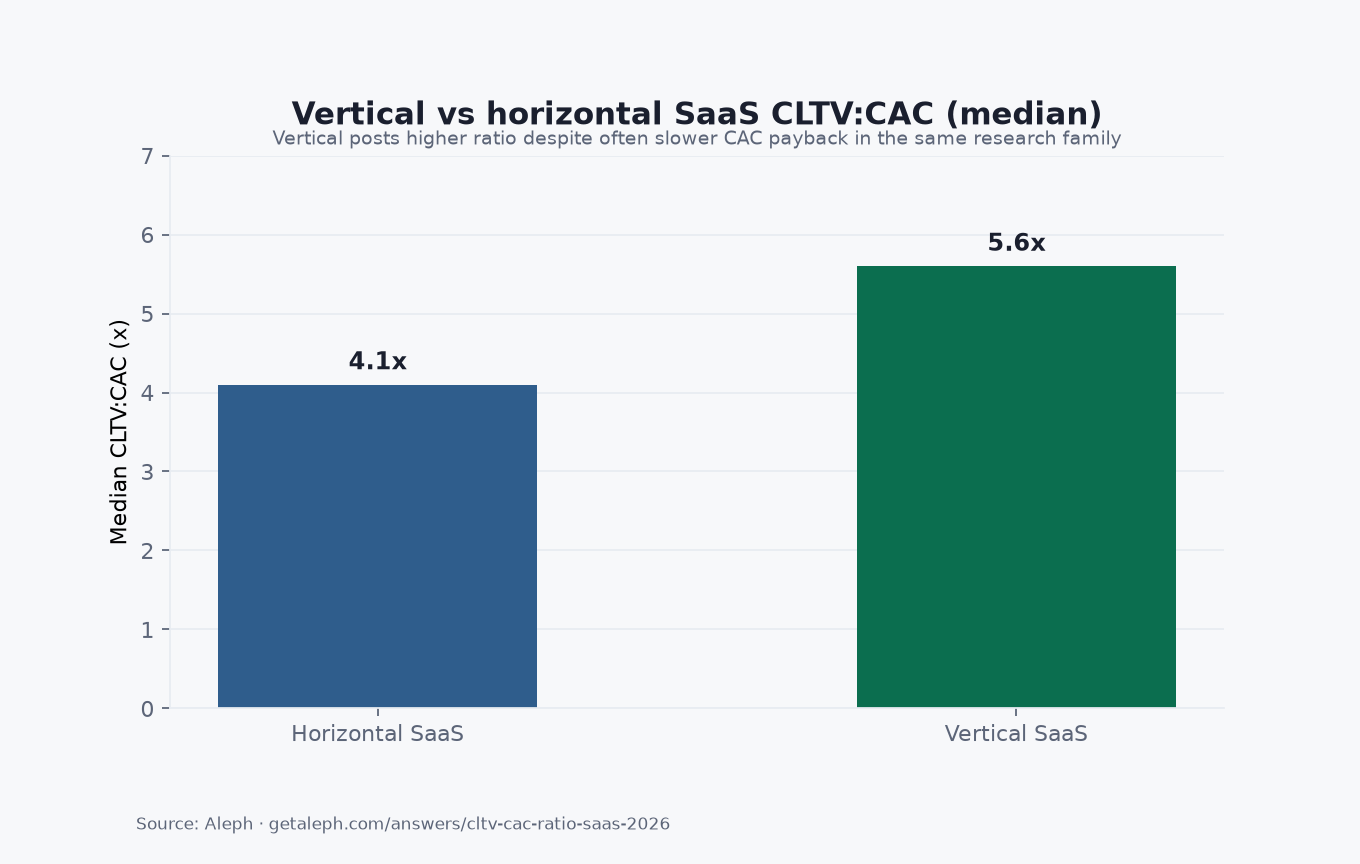
Source: Aleph, LTV:CAC ratio SaaS 2026 answer page. https://www.getaleph.com/answers/cltv-cac-ratio-saas-2026
Vertical’s higher ratio can coexist with slower payback. Aleph notes vertical CAC payback around 18 months versus about 14 for horizontal in the same research family. That is the cash-timing lesson: do not celebrate 5.6x while ignoring the months of float.
First Page Sage publishes LTV:CAC ratios for 29 industries from client work spanning 2019 to 2024. They average LTV and CAC over a three-year window, then divide. Caveats they state on the page: 68% of the data from organic channels, 74% from B2B firms, clients skew midsized and larger, so earlier-stage businesses should expect lower ratios (First Page Sage).
Selected rows (full table on their page):
| Industry | LTV:CAC ratio (FPS) | Notes |
|---|---|---|
| Commercial Insurance | 5:1 | Top of their published set |
| Higher Education & College | 5:1 | Long retention shapes LTV |
| Pharmaceutical | 5:1 | Compliance-heavy sales |
| SaaS (B2B) | 4:1 | Near Aleph’s SaaS median order of magnitude |
| eCommerce | 3:1 | Lower ticket / different retention |
| SaaS (B2C) | 2.5:1 | Consumer churn pressure |
| Entertainment | 2.5:1 | Lower end of their set |
| Solar Energy | 2.5:1 | Lower end of their set |
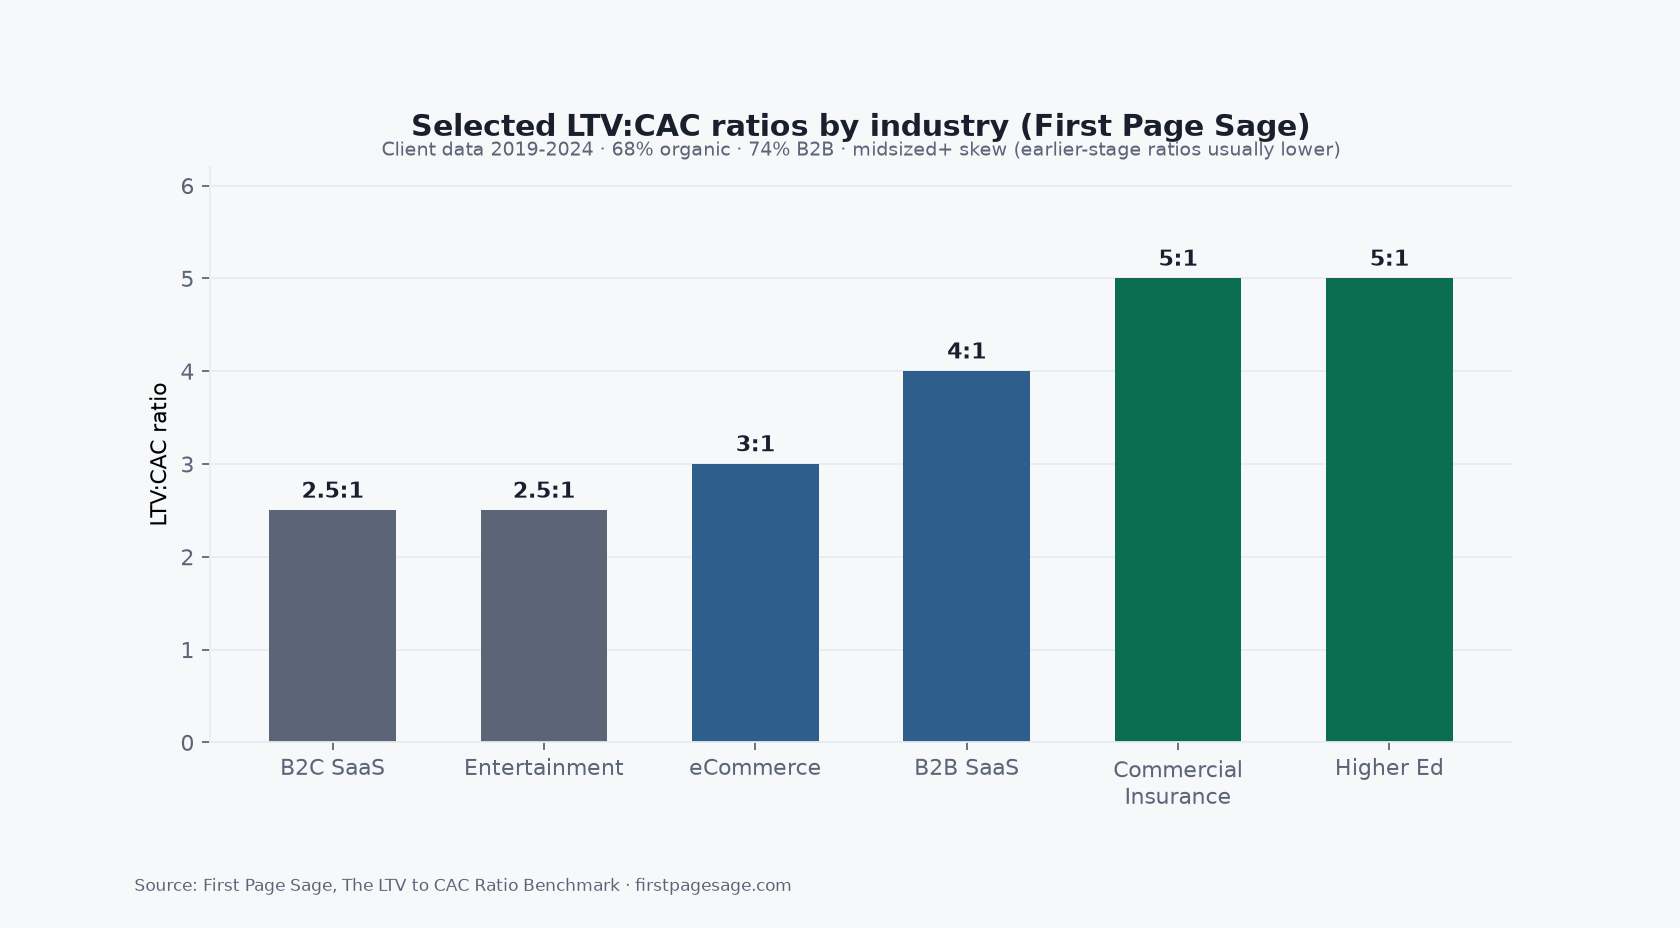
Source: First Page Sage, The LTV to CAC Ratio Benchmark (data 2019-2024; updated June 18, 2025). https://firstpagesage.com/seo-blog/the-ltv-to-cac-ratio-benchmark/
Do not mash FPS’s B2B SaaS 4:1 into Aleph’s 4.1x median and call it one study. Different samples, years, and LTV constructions. Use FPS for cross-industry shape. Use Aleph for current private SaaS distribution. Use Skok for the floor and payback rule of thumb.
Platform fee shape also changes contribution margin before LTV. See creator platform fee comparison when storefront take rates sit in the stack.
Q: What is a good LTV to CAC ratio? A: For recurring models, David Skok’s long-standing guidance is roughly 3x as a viability floor, with CAC recovery often targeted under 12 months. Aleph frames 3:1 as the minimum, 4x to 5x as healthy, and 7x+ as top-tier for SaaS in light of a 4.1x 2025 median.
Q: What are CAC vs LTV benchmarks by industry? A: They vary by source. First Page Sage’s 2019-2024 client table ranges from about 2.5:1 (for example B2C SaaS, entertainment, solar) to 5:1 (commercial insurance, higher education, pharmaceutical), with B2B SaaS at 4:1 and eCommerce at 3:1. Read their organic and B2B skew before you copy a row.
Q: What is the current SaaS LTV:CAC median? A: Aleph × Benchmarkit report a 4.1x median CLTV:CAC on full-year 2025 actuals among 146 of 342 companies that reported the metric, with a 7.8x top quartile and 1.1x bottom quartile. That is above the classic 3:1 floor.
Q: Should I use revenue LTV or gross-margin LTV? A: Prefer gross-margin (contribution) LTV. Aleph notes that computing lifetime value on raw revenue overstates the ratio, especially in lower-margin or usage-based businesses. Boards that approve spend on revenue LTV fund fantasy.
Q: Can LTV:CAC be too high? A: Yes. Aleph notes that ratios far above about 7x to 8x can signal under-investment in growth. A very high ratio with declining growth often means you should test more acquisition that still clears a healthy return, not celebrate starvation as efficiency.
CAC vs LTV benchmarks by industry are a three-layer read: Skok’s 3x floor and payback pair, Aleph’s 4.1x SaaS median distribution, and First Page Sage’s industry ladder with methodology attached. Match definitions before you match numbers. Pair every ratio with months to recover CAC. There is no single public dataset that crowns one universal good ratio for every stage and margin model.
If you are a merchant who wants performance-priced distribution through co-branded affiliate storefronts instead of only paid CAC, start at https://www.feat.press.
Performance marketing KPI benchmarks by channel: WordStream search, Triple Whale Meta 1.88 vs Google 3.27 ROAS, Dreamdata LinkedIn 121%.
How iOS privacy changes affected performance marketing: ATT cut conversion CTR ~37% in research, hurt Meta-heavy Shopify sales, forced MMM and lift tests.
Affiliate marketing for startups is an operating system—locks, cost, recruit, rates, tracking, first 100 sales, then diagnose a flat roster.