Email Preference Center Best Practices
Preference center best practices: CAN-SPAM menu plus stop-all, Google one-click vs body preference pages, and SendGrid's labeled 20% unsub drop.
Email deliverability benchmarks: Google/Yahoo 0.3% spam floors, Validity 2025 MBP inbox rates, and why delivery is not inbox.

TL;DR: Email deliverability benchmarks are a spam-complaint floor and authentication scorecard first. Google says keep Postmaster spam below 0.10% and avoid 0.30%. Yahoo says keep spam below 0.3% on inbox-delivered mail. Validity’s 2025 network puts global inbox placement at 87.2%. Your ESP “delivered” rate is not the inbox.
Founders celebrate a 98% delivered rate while Google Postmaster sits at 0.25% user-reported spam. That is not a healthy program. That is a dashboard that cannot see the spam folder. Email deliverability benchmarks exist to separate enforcement floors from vanity acceptance rates, and labeled inbox samples from seed-test folklore.
The full cluster map lives in the email marketing guide.
Open-rate ladders by industry live in email marketing benchmarks by industry. Cold-list hygiene that protects those floors lives in sunset email flow explained and winback email benchmarks. This page owns the deliverability scorecard.
550 5.7.515 rejection for non-compliance after May 5, 2025 enforcement (Microsoft).Email deliverability benchmarks are labeled targets and sample ranges for whether authenticated marketing mail reaches the inbox, stays under mailbox-provider spam-complaint floors, and fails cleanly when it does not, reported from named MBP rules or named measurement networks. They are a compliance scorecard with a placement chart attached, not a creative brief.
They are not your ESP’s delivered rate. Validity defines delivery as server acceptance (sent minus bounces) and inbox placement as mail that actually landed in the inbox, separate from spam-folder and missing/blocked shares (Validity). Operators on r/Emailmarketing learn the hard way that Postmaster spam rate is not the same number as ESP spam reports, because the denominators differ (thread).
If you only quote opens from email marketing benchmarks by industry, you are reading a downstream symptom. Deliverability is the pipe.
Email deliverability benchmarks matter because mailbox providers now enforce authentication and spam-rate floors on high-volume senders, while a high ESP delivery rate can still hide spam-folder placement that kills revenue and sender reputation. Miss the floor and every flow benchmark on your blog becomes academic.
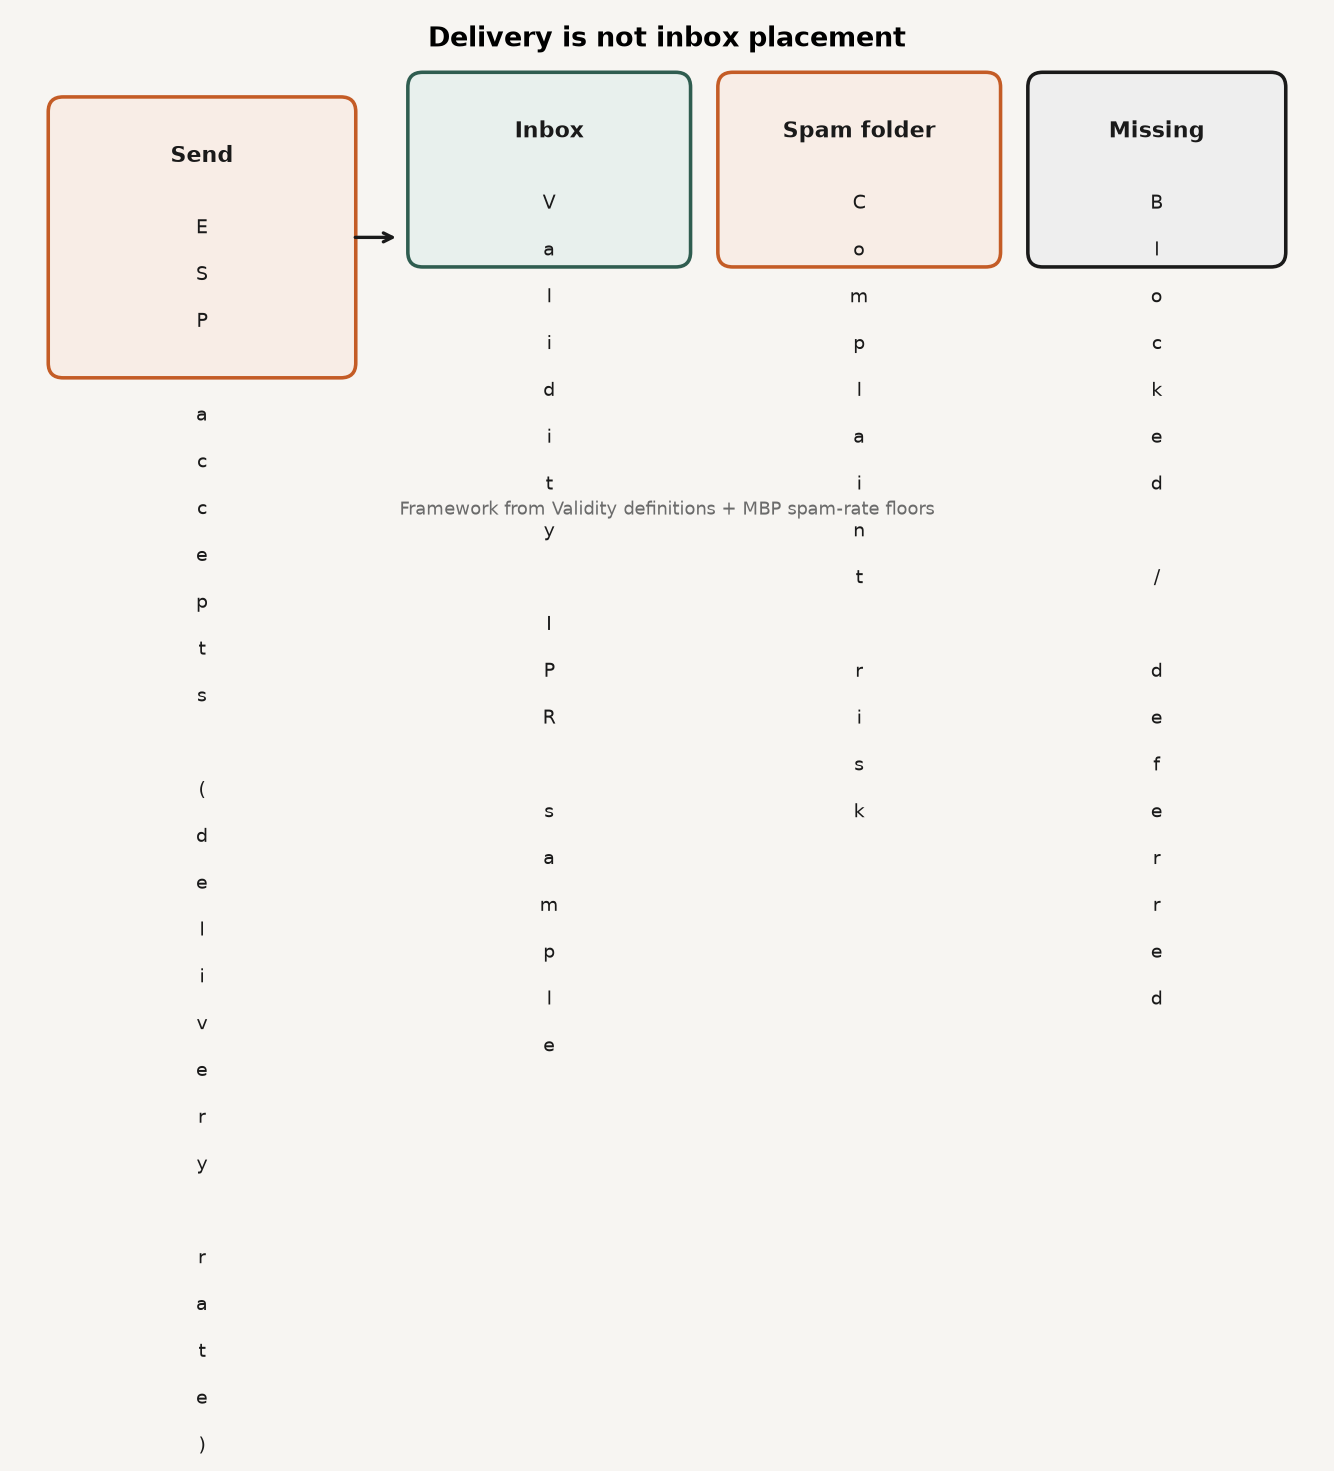
Source: Editorial framework synthesizing Validity’s delivery vs inbox definitions with Google and Yahoo spam-rate guidance. https://www.validity.com/wp-content/uploads/2026/03/2026-Benchmark-Report.pdf · https://support.google.com/a/answer/81126
Email deliverability benchmarks work when you separate three layers: enforcement floors (spam rate and authentication), labeled inbox-placement samples by mailbox provider, and seed-test panels that answer a different question. Mash the layers and you invent a fake national median. The sections below keep each layer in its own cell.
| Provider | Floor / guidance | Notes |
|---|---|---|
| Google (Postmaster) | Keep below 0.10%; avoid 0.30% or higher | Bulk senders also need SPF+DKIM+DMARC and one-click unsubscribe |
| Yahoo | Keep spam rate below 0.3% | Bulk: calculated on inbox-delivered mail; DMARC + one-click required |
| Validity (editorial) | Under 0.1% now the expectation | Historical guidance often cited 0.2-0.3%; label as Validity narrative |
Sources: Google; Yahoo; Validity.
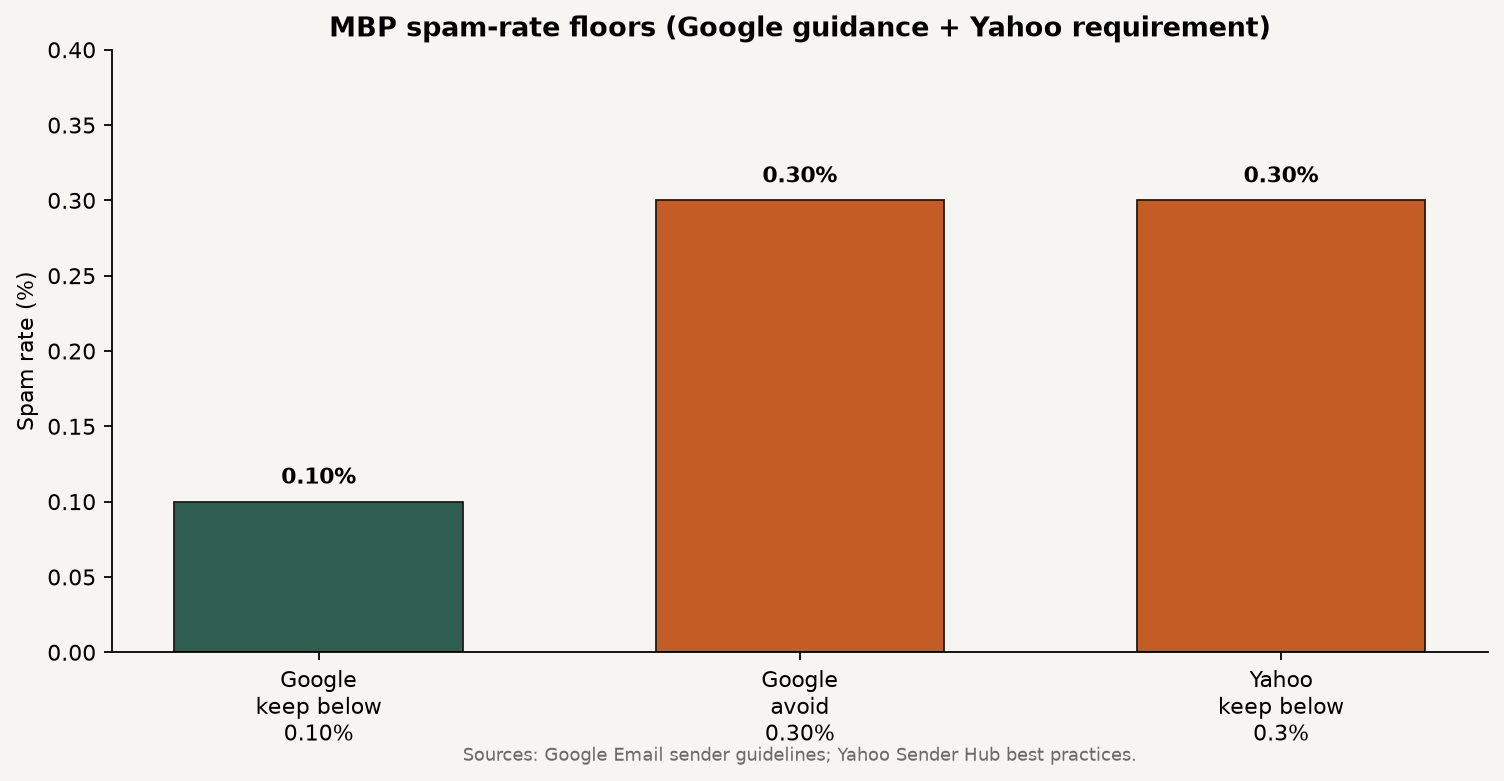
Source: Google Workspace Admin Help, Email sender guidelines; Yahoo Sender Hub best practices (0.3% requirement). https://support.google.com/a/answer/81126 · https://senders.yahooinc.com/best-practices/
For high-volume senders, the MAGY stack converges:
p=none for bulk paths at Google, Yahoo, and Microsoft consumer mail.Google and Microsoft both use a 5,000/day consumer-volume gate for the strict bulk package (Google; Microsoft). Fail Microsoft’s package and you risk Junk placement, then 550 5.7.515 rejection language for the sending domain.
| Sample | Metric | Figure | Read it as |
|---|---|---|---|
| Validity 2025 global | Inbox placement | 87.2% | Validity network average (+3.7 pp YoY) |
| Validity Gmail | Inbox placement | 89.8% | Largest MBP in Validity’s share table |
| Validity Yahoo | Inbox placement | 87.3% | Includes ATT/Comcast migration effects in outlook |
| Validity Apple | Inbox placement | 82.0% | Halo from other MBP compliance, per Validity |
| Validity Microsoft | Inbox placement | 77.4% | Toughest MAGY average in the report |
| Unspam 2026 tests | Primary inbox | 63% | Seed-test aggregate, Jan-Sep 2026; not Validity |
Sources: Validity PDF; Unspam.
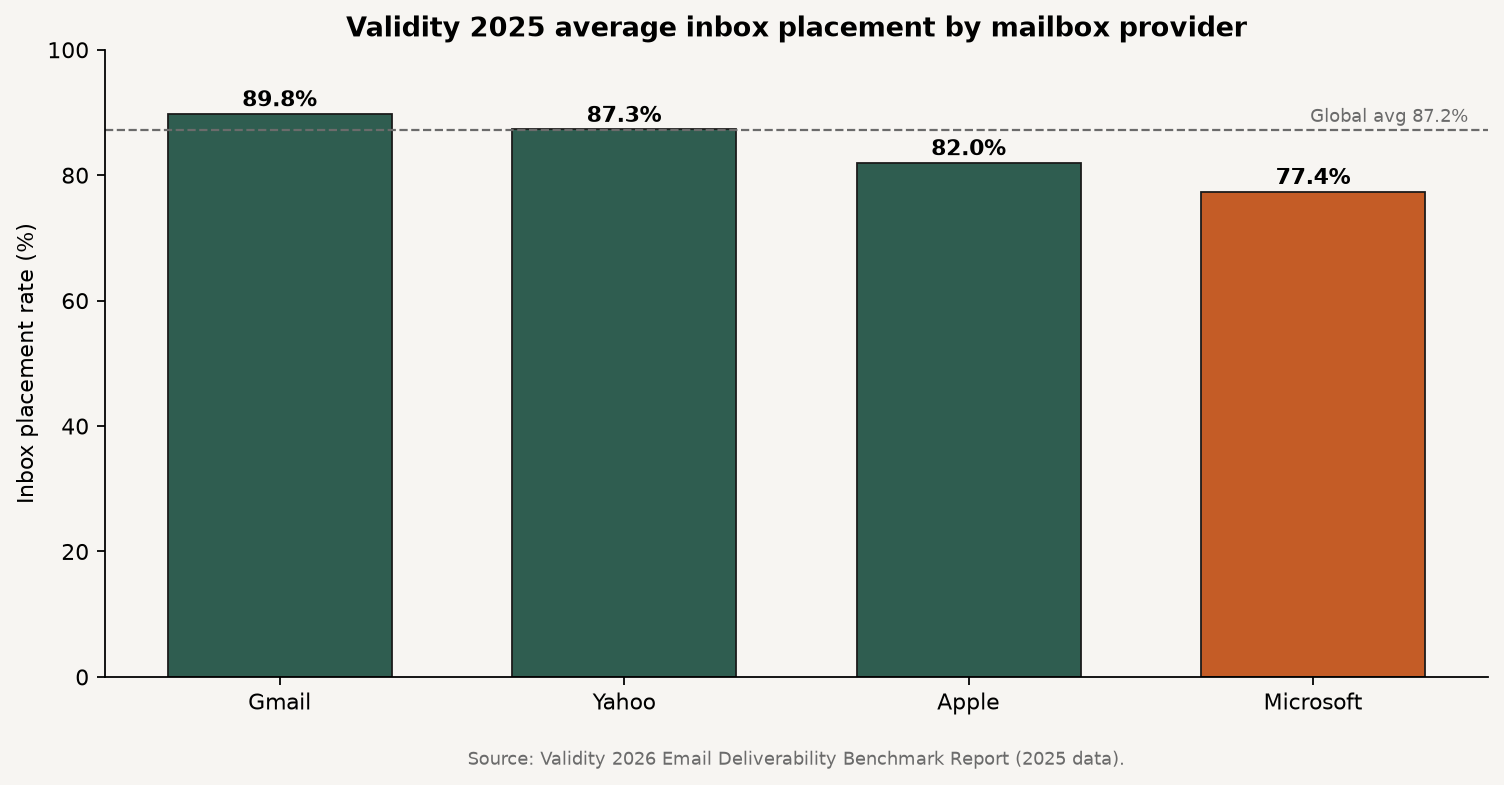
Source: Validity 2026 Email Deliverability Benchmark Report (2025 data). https://www.validity.com/wp-content/uploads/2026/03/2026-Benchmark-Report.pdf
Do not average Validity 87.2% with Unspam 63%. Different instruments. Validity summarizes a large inbox-data network. Unspam aggregates seed-mailbox tests across senders that include colder and more mixed traffic. Both can be true. Neither is “the” industry median.
Apple Mail Privacy Protection still inflates opens (email marketing benchmarks by industry; how iOS privacy changes affected performance marketing). Use opens as a smoke alarm for deliverability collapses, not as proof of inbox love. Prefer clicks, replies, purchases, Postmaster spam rate, and seed or panel inbox placement when you score the pipe.
There is no public dataset for a single official global inbox-placement census that merges Validity, Unspam, EmailConsul, and agency blogs into one number. There is also no public dataset here for a feat. proprietary deliverability study. Quote the floor, quote the labeled sample, name the method.
Using email deliverability benchmarks means fixing authentication and spam-rate floors before you chase subject-line theater, then reading inbox placement by mailbox provider with the sample label attached. Sunset cold profiles that manufacture complaints. Re-check Postmaster after every major list import.
These answers restate the Google and Yahoo spam-rate floors, the Validity versus Unspam sample split, and the delivery-versus-inbox distinction so a founder can quote labeled sources without inventing one national inbox median. Use them as short answers next to the tables above.
Q: What are good email deliverability benchmarks in 2026? A: Start with enforcement floors: Google keep Postmaster spam below 0.10% and avoid 0.30%; Yahoo keep spam below 0.3%. For inbox placement, Validity’s 2025 network average is 87.2% global, with Microsoft lower at 77.4% and Gmail higher at 89.8%. Do not treat Unspam’s 63% seed-test primary-inbox figure as the same metric.
Q: What is the difference between delivery rate and inbox placement? A: Delivery rate is whether the receiving server accepted the message (ESP sent minus bounces). Inbox placement is whether it landed in the inbox versus spam or missing/blocked. Validity treats those as separate metrics. A high delivery rate can still hide spam-folder placement.
Q: What spam complaint rate is acceptable? A: Google tells senders to keep Postmaster spam rates below 0.10% and avoid reaching 0.30%. Yahoo requires keeping spam rate below 0.3%, calculated on inbox-delivered mail for its bulk view. Validity’s 2026 report says under 0.1% is now the expectation. Aim under 0.1%, treat 0.3% as the cliff.
Q: Why does Google Postmaster spam rate not match my ESP? A: Different denominators and feedback channels. Postmaster focuses on user-reported spam against Gmail inbox mail for eligible authenticated traffic. Many ESPs report feedback-loop complaints across providers against total sent. Reddit threads regularly show large gaps between the two. Trust Postmaster for Gmail enforcement risk.
Q: Do I need DMARC if my open rates look fine? A: If you send at bulk volume to Gmail, Yahoo, or Outlook.com consumer mail, yes for the high-volume path: SPF, DKIM, and DMARC with alignment are baseline requirements, not optional polish. Open rates can look fine while you are one enforcement pass away from Junk or rejection.
Email deliverability benchmarks reward the teams that treat spam-rate floors and authentication as the product, then read inbox placement as a labeled sample by mailbox provider. Validity’s 87.2% global average and Google’s 0.10% / 0.30% rails are the planning spine. Your ESP delivered percentage is the wrong north star.
If the engaged inboxes you protect should buy through creator storefronts, browse the feat. marketplace for co-branded inventory.
Preference center best practices: CAN-SPAM menu plus stop-all, Google one-click vs body preference pages, and SendGrid's labeled 20% unsub drop.
Mailchimp vs Klaviyo: contact billing fork, send multipliers (10x/12x/15x), starting prices, and when ecommerce depth beats a general ESP.
Email list growth benchmarks: Omnisend 1.24B popup displays at 2.1%, form-type ladder, and levers that beat the average without inventing MoM %s.