Email Preference Center Best Practices
Preference center best practices: CAN-SPAM menu plus stop-all, Google one-click vs body preference pages, and SendGrid's labeled 20% unsub drop.
Email marketing benchmarks by industry for 2026: MailerLite opens and clicks, Klaviyo flow vs campaign gaps, and why Apple MPP makes open rate directional

TL;DR: Email marketing benchmarks by industry are labeled ESP scorecards, not one “good open rate.” MailerLite’s 3.6M-campaign set puts median open near 43.5% and click near 2.1%, while Klaviyo’s ecommerce sample shows flows beating campaigns about 3x on clicks and 13x on placed orders. Treat open rate as directional after Apple Mail Privacy Protection.
Founders still ask for email marketing benchmarks by industry so they can declare a 40% open rate a win. That sentence is how budgets get managed on a broken meter. Opens are polluted. Industry bands still matter. The fix is to read the right scorecard.
The full cluster map lives in the email marketing guide.
Email marketing benchmarks by industry should mean published open, click, and conversion ranges from named ESP datasets, split by campaign versus automated flow when the source allows it, with Apple Mail Privacy Protection called out in the same paragraph. Pair this with performance marketing KPI benchmarks by channel, how iOS privacy changes affected performance marketing, content marketing ROI by industry, and organic vs paid growth.
Email marketing benchmarks by industry means published medians or averages for open rate, click rate, click-to-open rate, unsubscribe rate, and sometimes placed-order rate, broken out by vertical inside a named ESP sample. They are peer comparisons inside a dataset, not a census of every inbox on earth.
That definition already kills the LinkedIn graphic that says “the average email open rate is X%” with no ESP, no year, and no campaign-versus-flow split. MailerLite’s 2026 report is a broad SMB and creator-heavy campaign sample across 46 industries. Klaviyo’s 2026 benchmarks lean ecommerce and separate campaigns from automated flows. ActiveCampaign’s customer postings are a third sample. Mixing those into one cell is how you get a fake planning number.
Treat every table as answering three questions: which ESP, which email type, and which metric still survives privacy and bot noise. If the vendor cannot say, assume you are buying vibes.
They matter because industry mix, list quality, and email type move click and order rates more than subject-line folklore. A software founder chasing a religion-sector open rate is not ambitious. They are mislabeled. Use the peer band for your vertical, then move the budget toward metrics privacy cannot fake.
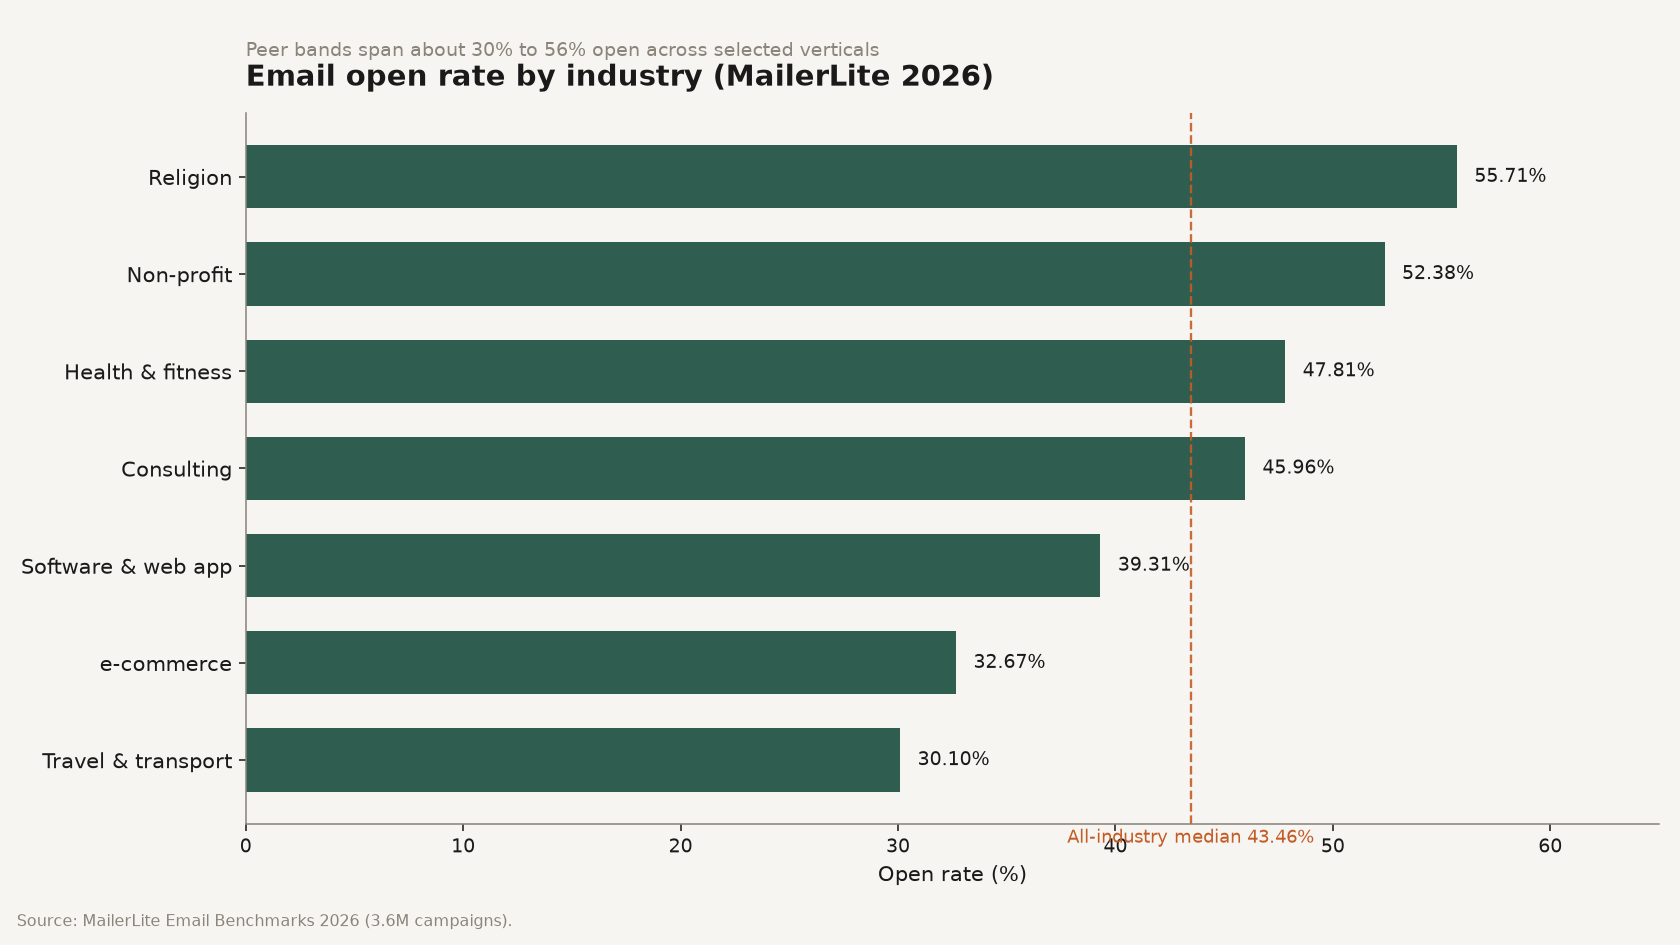
Source: MailerLite, Email marketing benchmarks by industry and region for 2026 (3.6M campaigns, Dec 2024–Nov 2025). https://www.mailerlite.com/blog/compare-your-email-performance-metrics-industry-benchmarks.
Read email benchmarks by stacking two ESP scorecards, then demoting open rate after Apple MPP. Industry tables tell you peer ranges for campaigns. Campaign-versus-flow tables tell you where revenue usually hides. Privacy notes tell you which dashboard cell to stop worshiping as a team KPI.
| Industry (MailerLite 2026) | Open rate | Click rate |
|---|---|---|
| Religion | 55.71% | 2.95% |
| Non-profit | 52.38% | 2.90% |
| Health and fitness | 47.81% | 1.45% |
| Consulting | 45.96% | 2.41% |
| Author | 43.14% | 2.75% |
| Software and web app | 39.31% | 1.15% |
| Retail | 37.47% | 1.27% |
| e-commerce | 32.67% | 1.07% |
| Travel and transportation | 30.10% | 1.68% |
| All industries (median / average as published) | 43.46% open | 2.09% click |
Source: MailerLite Email Benchmarks 2026. Dataset: over 3.6 million campaigns from 181,000 approved accounts, December 2024 to November 2025. Unsub overall 0.22%. CTOR overall 6.81%.
Those e-commerce open and click cells already tell a founder story. High passion niches open more. Transactional retail opens less and clicks less on broadcast campaigns. That is not a moral failing. It is list intent.
Region adds another fork. MailerLite shows Australia open near 47.69% and US/Canada near 44.49%, with LATAM nearer 31.97%, and notes high iPhone markets are more exposed to MPP inflation. Compare inside your region when you can.
| Metric (Klaviyo 2026) | Campaigns (avg) | Automated flows (avg) | Rough multiple |
|---|---|---|---|
| Open rate | 31% | 32.2% | ~1.0x |
| Click rate | 1.69% | 5.58% | ~3x |
| Placed order rate | 0.16% | 2.11% | ~13x |
| Top 10% click | 3.38% | 10.48% | — |
| Top 10% placed order | 0.36% | 4.3% | — |
Source: Klaviyo Email Marketing Benchmarks 2026. On-page sample size claim: over 205,000 brands. Flows also generated nearly 41% of email revenue from 5.3% of sends.
Opens barely move between campaigns and flows in that sample. Clicks and orders explode. If your dashboard still ranks teams on open rate alone, you will underfund cart recovery, welcome series, and replenishment while overfunding another “fun” newsletter.
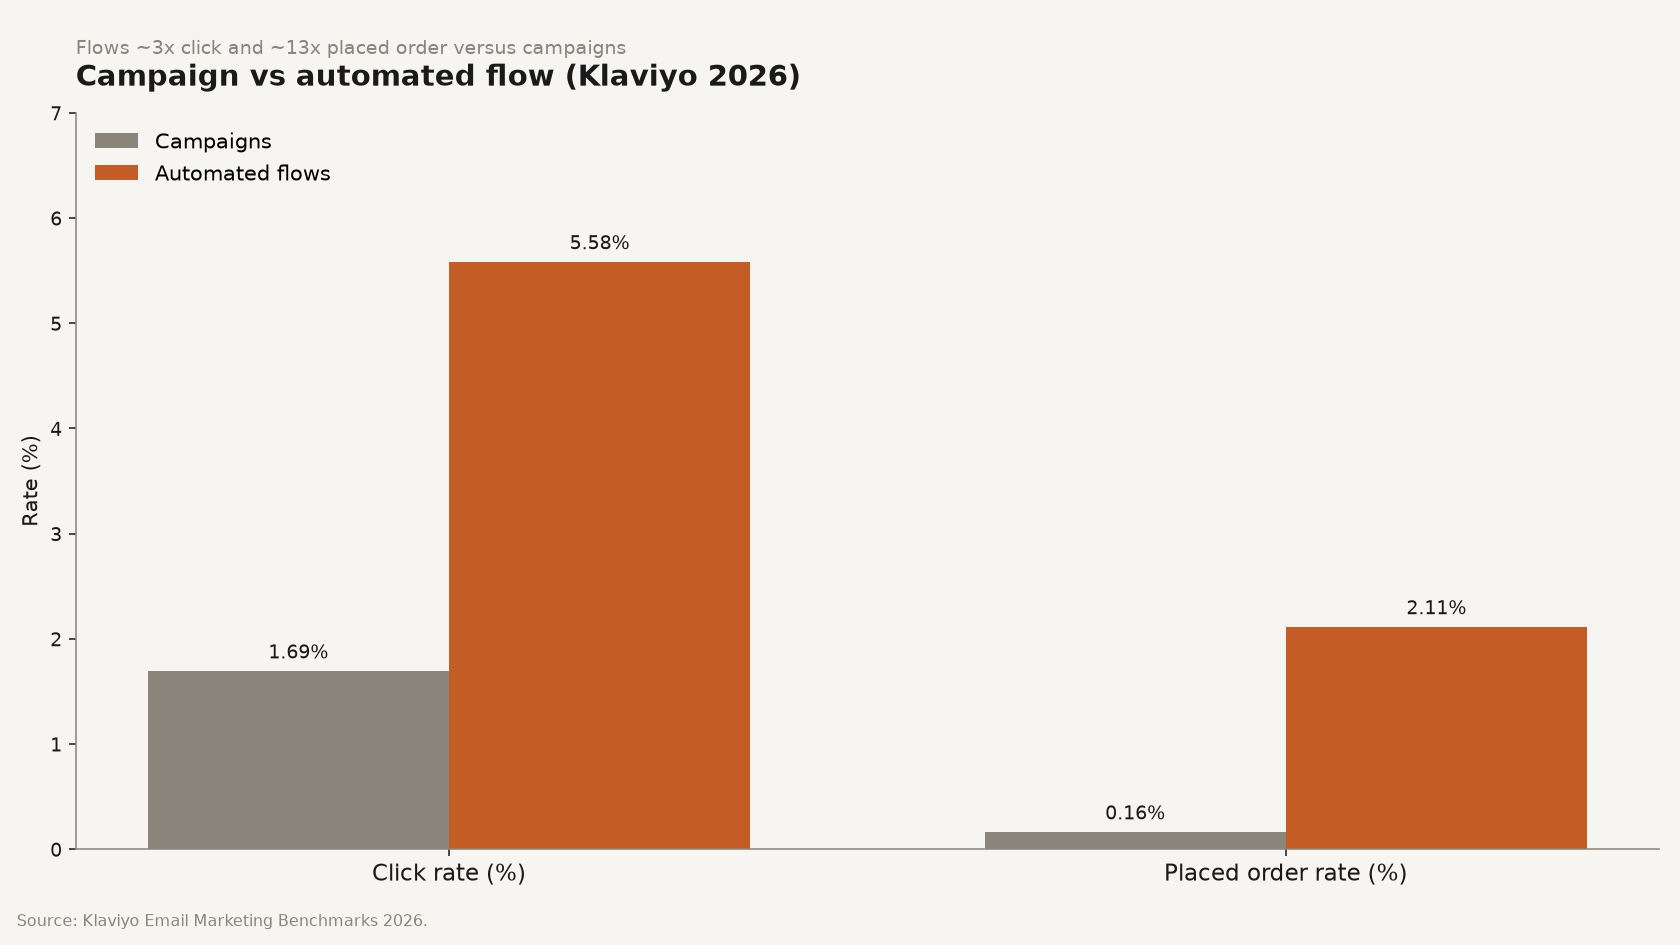
Source: Klaviyo, Email marketing benchmarks 2026 (open, click, and conversion rates). https://www.klaviyo.com/uk/blog/email-marketing-benchmarks-open-click-and-conversion-rates.
Apple’s privacy materials state that Protect Mail Activity downloads remote content in the background by default, whether or not the recipient engages (Apple). That prefetch loads tracking pixels. Your ESP counts an open. The human may never have seen the subject line.
MailerLite says Apple MPP automatically marks emails to Apple Mail clients as opened, so real open rates are lower than dashboards and their own tables show. Klaviyo’s own disclaimer says open rate is “not 100% effective” for the same reason. Constant Contact summarizes the practical consequence: open rates can rise while becoming less reliable (Constant Contact).
Community language matches the mechanics. Threads still say “opens are dead,” “email tracking is basically broken in 2026,” and that “consistent 40 to 50 percent open rates were often not real.” Believe the privacy design docs, not the vanity chart.
Do not invent a universal “subtract 15 points” rule. That adjustment is no public dataset as a national census in this article. Keep opens for deliverability trends by mailbox provider. Optimize on clicks, replies where relevant, placed orders, and revenue per recipient.
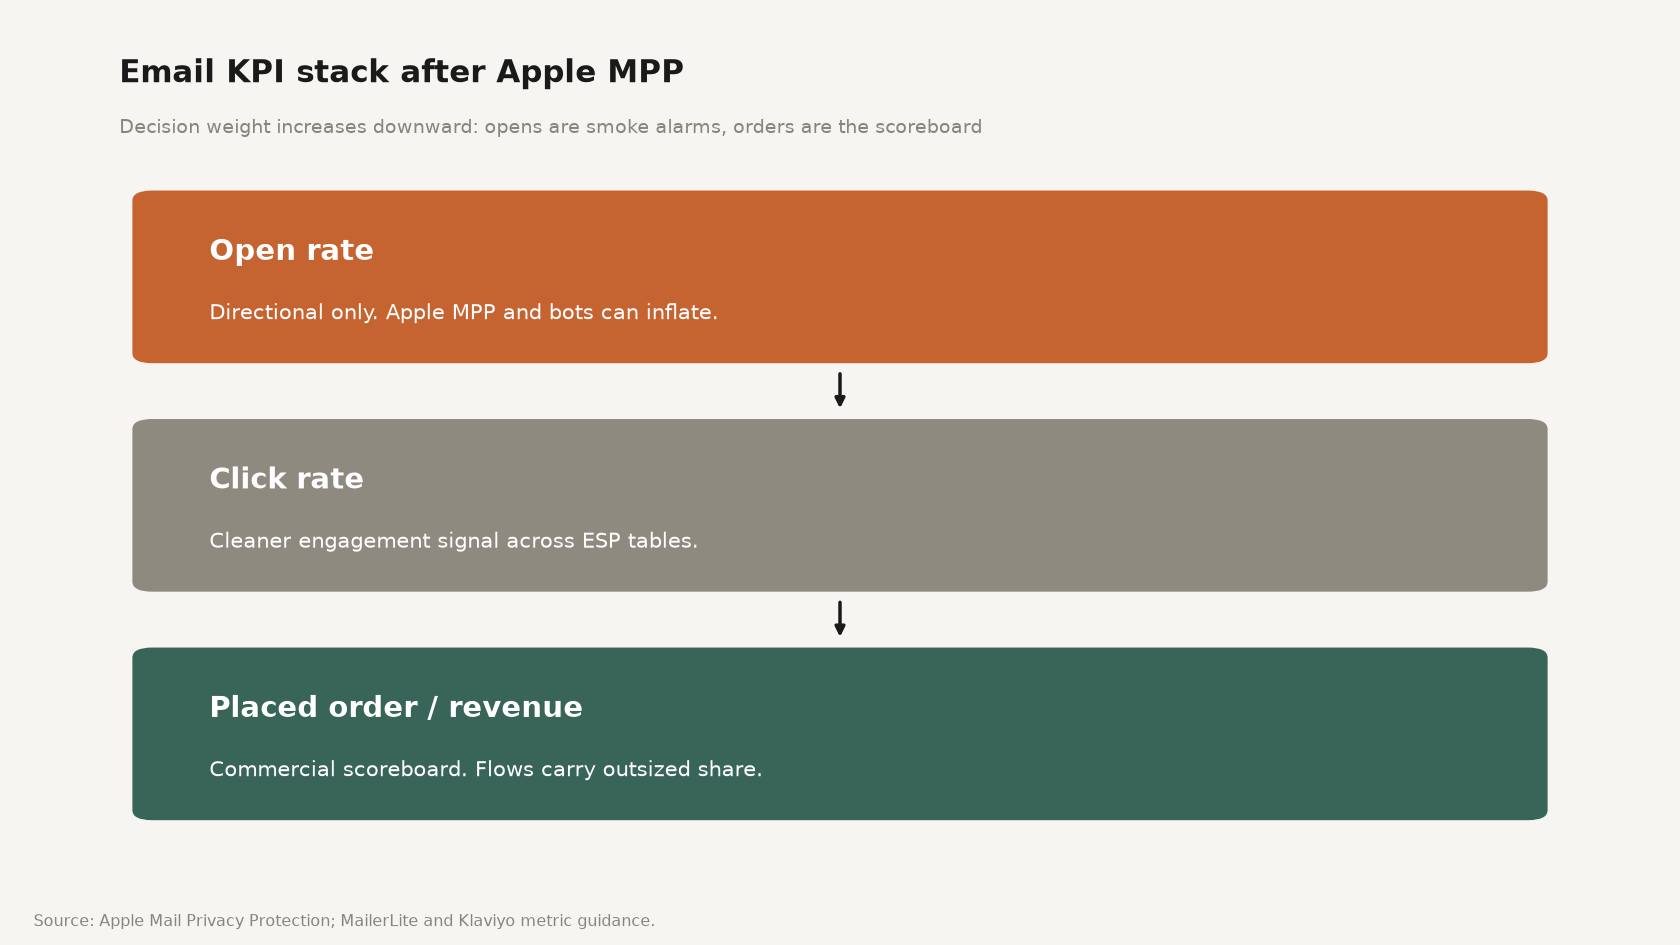
Source: Framework synthesizing Apple Mail Privacy Protection behavior with MailerLite and Klaviyo metric guidance. https://www.apple.com/legal/privacy/data/en/mail-privacy-protection/ ; https://www.mailerlite.com/blog/compare-your-email-performance-metrics-industry-benchmarks.
These answers restate the MailerLite industry ladder, the Klaviyo campaign-versus-flow gap, and the Apple MPP open-rate caveat. Use them when someone wants a number fast. Open the comparison tables when they start budgeting a real send calendar or flow roadmap.
Q: What are email marketing benchmarks by industry in 2026? A: Use named ESP tables. MailerLite’s 3.6M-campaign set shows median open about 43.46% and click about 2.09%, with industry opens from roughly 30% to 56%. Klaviyo’s ecommerce-leaning sample separates campaigns from flows and puts campaign click near 1.69% versus flow click near 5.58%.
Q: What is a good average email open rate by industry? A: It depends on the vertical and the ESP. MailerLite puts ecommerce near 32.67% open and non-profits near 52.38%. After Apple Mail Privacy Protection, treat those opens as directional peers, not proof that half your list read the email.
Q: How do email campaign benchmarks differ from automated flow benchmarks? A: In Klaviyo’s 2026 benchmarks, opens are similar, but flows show about 3x the campaign click rate (5.58% vs 1.69%) and about 13x the placed order rate (2.11% vs 0.16%). Flows also contributed nearly 41% of email revenue from 5.3% of sends in that cut.
Q: Does Apple Mail Privacy Protection inflate open rates? A: Yes for Apple Mail users with Protect Mail Activity enabled. Apple downloads remote content in the background whether or not the person engages, which can fire tracking pixels. Prefer click rate, placed orders, and revenue metrics for optimization.
Q: Why shouldn’t I manage email only on open rate? A: Because privacy prefetch and bots can inflate opens while clicks and orders stay flat. MailerLite and Klaviyo both warn about MPP. A team that only chases open rate will underinvest in flows that actually move revenue.
Email marketing benchmarks by industry are useful when you keep the labels on every cell. MailerLite gives a wide industry ladder for campaign peers. Klaviyo shows how automated flows outrun broadcasts on clicks and orders. Apple’s privacy design explains why open rate is directional. Plan with click and conversion bands, and refuse one fake national open rate.
If you want partners who can distribute finished offers while you keep owned channels compounding, start at feat..
Preference center best practices: CAN-SPAM menu plus stop-all, Google one-click vs body preference pages, and SendGrid's labeled 20% unsub drop.
Mailchimp vs Klaviyo: contact billing fork, send multipliers (10x/12x/15x), starting prices, and when ecommerce depth beats a general ESP.
Email list growth benchmarks: Omnisend 1.24B popup displays at 2.1%, form-type ladder, and levers that beat the average without inventing MoM %s.