Email Preference Center Best Practices
Preference center best practices: CAN-SPAM menu plus stop-all, Google one-click vs body preference pages, and SendGrid's labeled 20% unsub drop.
Welcome email benchmarks: GetResponse 83.63% single open, Omnisend 35.53% ecommerce welcome, Klaviyo 51.26% series plus RPR and placed-order scorecards.

TL;DR: Welcome email benchmarks are labeled ESP samples, not one “good open rate.” GetResponse’s single welcome hits 83.63% open. Omnisend’s ecommerce welcome automation sits near 35.53% open with $6.16 per email. Klaviyo’s series average is 51.26% open and $2.35 RPR. Plan on clicks, orders, and dollars.
Founders paste three welcome open rates into one slide and call the average a target. That is how you “underperform” a fictional KPI. A single triggered thank-you is not a five-email series. An ecommerce automation sample is not a cross-industry message-type table. The labels are the product.
The full cluster map lives in the email marketing guide.
Welcome email benchmarks are published open, click, conversion, and revenue figures for the emails you send when someone joins a list. This page owns the welcome scorecard. Broader industry ladders and campaign-versus-flow gaps live in email marketing benchmarks by industry. Cart recovery lives in abandoned cart email benchmarks. Privacy context for opens lives next to how iOS privacy changes affected performance marketing.
Welcome email benchmarks are labeled performance ranges for the automated messages a brand sends after signup, usually reported as open rate, click rate, conversion or placed-order rate, and revenue per email or per recipient from a named ESP sample you can cite.
They are not the same scorecard as a Tuesday campaign blast, and they are not interchangeable across ESPs. GetResponse’s “welcome email” cell is a message type inside a cross-industry automation table. Omnisend’s “Welcome” row is an ecommerce automation type with dollars attached. Klaviyo’s welcome figures describe series performance with RPR and placed order. Mixing those cells without labels is how AI Overviews and Slack threads invent “the” open rate.
On r/Emailmarketing, operators already argue that open rate on a welcome sequence is a vanity metric next to thirty-day conversion (thread). The public datasets below give you numbers worth putting in a planning memo. The job is to keep the definition attached.
Welcome email benchmarks matter because signup is peak intent you already paid to acquire. Misread the open rate and you either panic about a healthy series or celebrate machine opens. Read the revenue cells and you fund the flow before another low-intent broadcast.
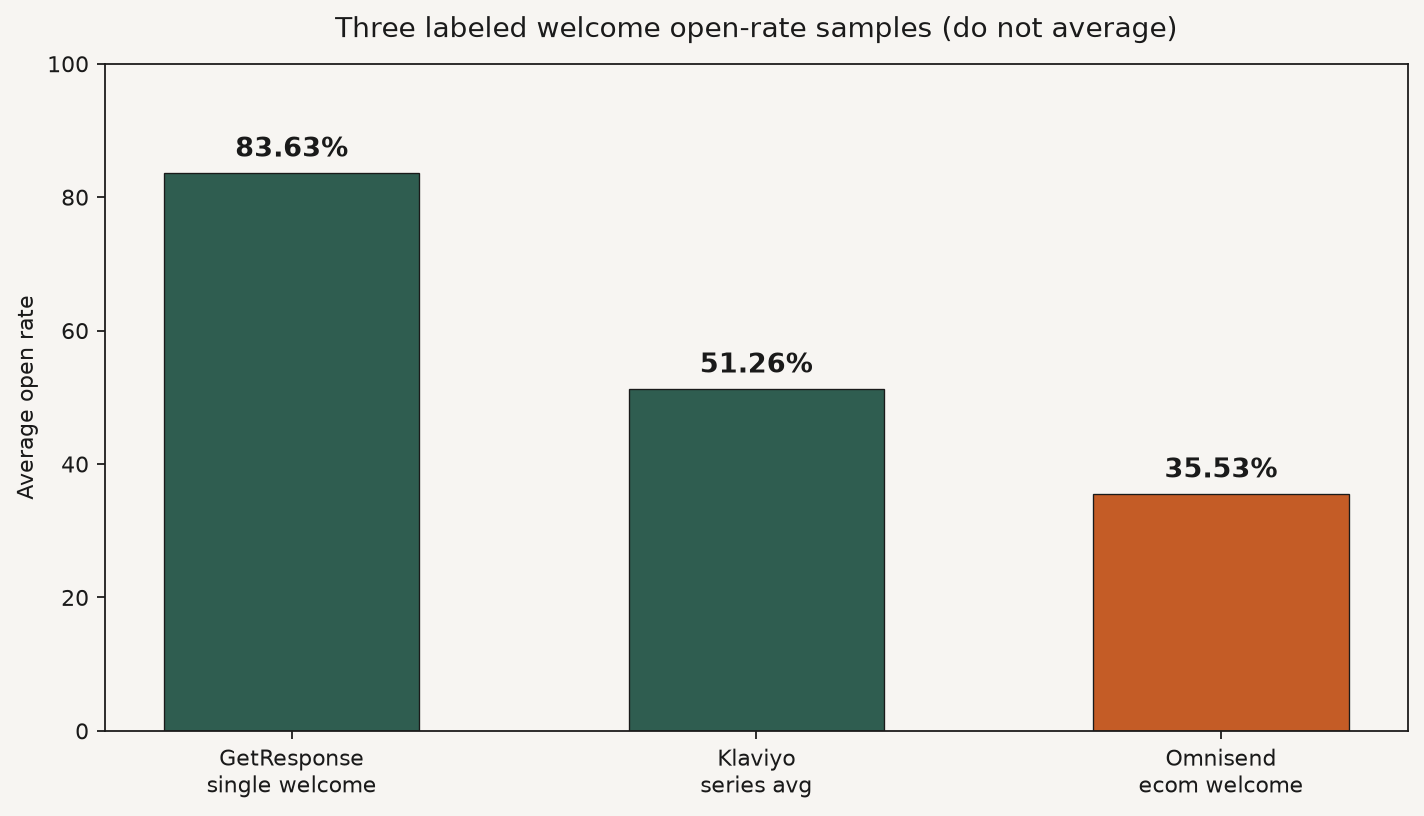
Source: GetResponse 2024 Email Marketing Benchmarks (2023 sends), https://www.getresponse.com/blog/email-marketing-benchmarks-report-key-insights; Klaviyo welcome email examples (Apr 23, 2025; 2025 benchmarks), https://www.klaviyo.com/blog/welcome-email-examples; Omnisend email marketing benchmarks (2025 ecommerce automation data), https://www.omnisend.com/blog/email-marketing-benchmarks/. Labeled samples, not one universal median.
Welcome email benchmarks work as a three-sample triangulation plus a four-metric scorecard. Match your send type to the right labeled open rate. Then manage the series on click rate, conversion or placed order, and revenue per email or recipient. Suppress calendar blasts while the series runs.
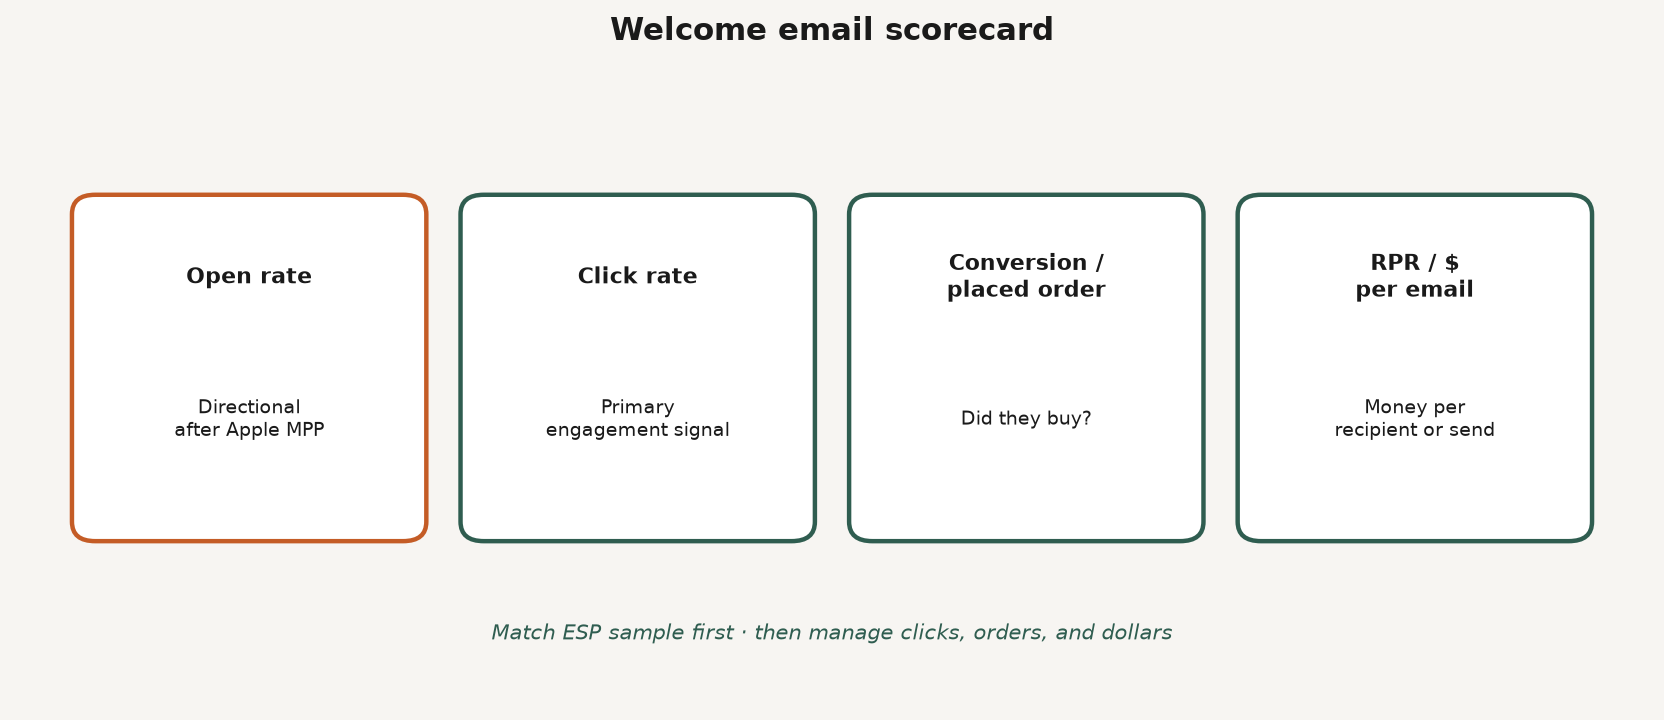
Source: Editorial scorecard synthesizing GetResponse, Omnisend, and Klaviyo metric definitions with Apple MPP open-rate caveat. https://www.omnisend.com/blog/email-marketing-benchmarks/
| Sample | What it measures | Open rate | Click / engagement | Notes |
|---|---|---|---|---|
| GetResponse welcome | Message type “Welcome email” in 2023 cross-industry sends | 83.63% | CTR 16.6% | Immediate single-welcome style cell |
| GetResponse autoresponder | Autoresponder sequences in the same report | 51.05% | CTR 5.59% | Closer to multi-email drip averages |
| Klaviyo welcome series | Welcome series across industries (2025 benchmarks cited) | 51.26% | Top click ~15%; avg placed order 1.97% | Series average with RPR |
| Omnisend Welcome automation | Ecommerce welcome automations (2025) | 35.53% | CTR 3.94%; CTOR 11.19%; conversion 2.11% | Dollars: $6.16 / email |
Sources: GetResponse; Klaviyo; Omnisend.
If your first email fires in seconds and you are reading a GetResponse-style single-welcome cell, 80%+ opens are plausible in that methodology. If you are reading Omnisend’s ecommerce automation average across a welcome flow, ~35% open with 2.11% conversion is the planning band. If you are on Klaviyo and looking at series averages, ~51% open with $2.35 RPR is the published center.
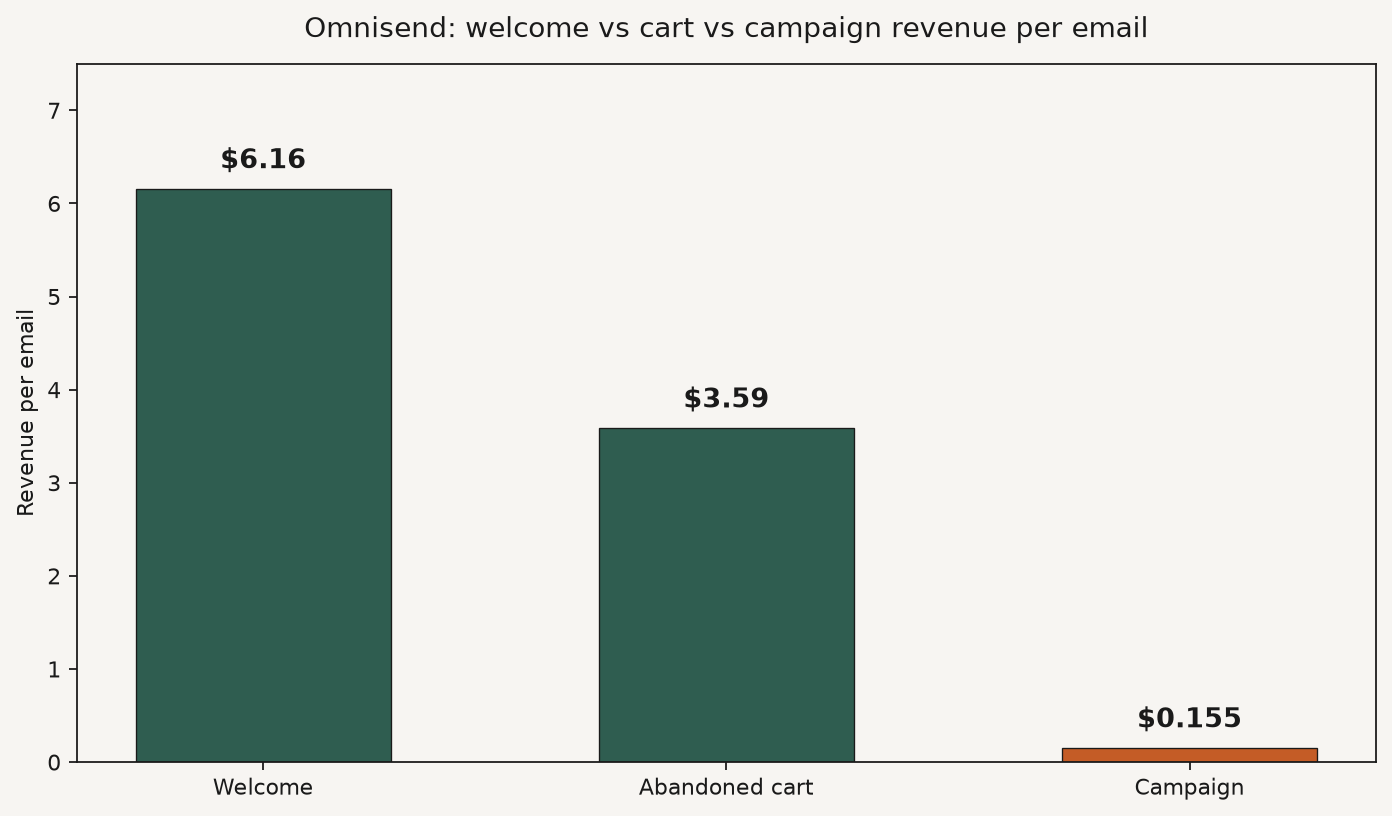
Source: Omnisend Email Marketing Benchmarks (2025 data; article May/Sep 2026). https://www.omnisend.com/blog/email-marketing-benchmarks/
| Metric | Labeled figure | Source read |
|---|---|---|
| Omnisend welcome $ / email | $6.16 | Highest non-back-in-stock automation dollar in the published table after product restock |
| Omnisend welcome conversion | 2.11% | Versus campaign conversion 0.08% in the same dataset |
| Omnisend welcome CTR / CTOR | 3.94% / 11.19% | Click quality among opens |
| Omnisend welcome unsubscribe | 0.87% | Higher than many transactional automations; early-relationship tax |
| Klaviyo welcome RPR | $2.35 | Revenue per recipient for the series |
| Klaviyo welcome placed order | 1.97% avg; nearly 10% top | Order rate among recipients |
| Klaviyo top welcome click | 15% | Top-performing welcome emails |
Do not convert Omnisend’s $ per email into Klaviyo’s RPR without a methodology note. One is revenue divided by emails sent in that automation type. The other is revenue per recipient in the welcome series. Both say the flow pays. Neither licenses inventing a feat. proprietary “welcome ROI.”
In Omnisend’s table, welcome ($6.16) out-earns abandoned cart ($3.59) on a per-email basis, while cart remains the most widely used high-value automation (22.5% of brands with automations) (Omnisend). That does not mean you skip cart recovery. It means new-list intent is expensive to waste. Pair this page with abandoned cart benchmarks when you are sequencing the first thirty days.
Campaign sends in that Omnisend cut averaged $0.155 per email and 0.08% conversion. Automations averaged $3.41 and 1.49% conversion, about 22x and 19x (Omnisend). Welcome is one reason the automation column looks unfair.
A r/Emailmarketing operator sample of ecommerce welcomes found an average of 3 emails over 4 days, with 83% of brands offering a discount and 10% off as the most common offer (~38%) (thread). Treat that as vernacular for “short series with a clear ask,” not as a mandatory template. Klaviyo advisors often talk about a roughly ten-day purchase window after signup (Klaviyo). Suppress promotional calendar sends while someone is still inside the welcome path so their first impression is not a random blast.
There is no public dataset that publishes one official welcome open rate for every ESP, every industry, and every single-versus-series definition at once. Secondary posts that mash GetResponse’s 83.63% with Omnisend’s 35.53% into a “typical 50-80% band” without labels stay out of the charts. feat. does not publish a proprietary welcome census here.
Using welcome email benchmarks means picking the sample that matches your ESP and send type, then managing the series on clicks, orders, and dollars. Open rate is a directional check after Apple MPP. Structure stays short until your own cohort data says otherwise.
These answers restate the three-sample open-rate spread, the revenue and conversion scorecard, and the Apple Mail Privacy Protection caveat so a founder can quote a labeled number without inventing one fake national average for every ESP and every series length.
Q: What are good welcome email benchmarks in 2026? A: Use labeled samples. GetResponse’s single welcome shows 83.63% open and 16.6% CTR. Omnisend’s ecommerce welcome automation shows 35.53% open, 3.94% CTR, 2.11% conversion, and $6.16 per email. Klaviyo cites 51.26% open, $2.35 RPR, and 1.97% placed order for welcome series.
Q: What is a good welcome email open rate? A: It depends on the definition. A single immediate welcome can look like GetResponse’s 83.63%. An ecommerce automation average can look like Omnisend’s 35.53%. A series average can look like Klaviyo’s 51.26%. After Apple MPP, prefer click and conversion when the three conflict.
Q: How do welcome email benchmarks compare to regular campaigns? A: Automations win on money. Omnisend reports welcome at $6.16 per email versus $0.155 for campaign emails, and 2.11% conversion versus 0.08% for campaigns. Klaviyo’s wider flow cut still shows flows carrying nearly 41% of email revenue from 5.3% of sends.
Q: How many emails should a welcome series include? A: Public operator samples often land near three emails over a few days. Klaviyo advisors talk about covering roughly the first ten days after signup. Start short, suppress blasts during the series, and extend only when your placed-order and unsubscribe data justify it.
Q: Should I judge a welcome series by open rate alone? A: No. Open rate is directional under Mail Privacy Protection. Manage welcome email benchmarks with click rate, conversion or placed order, and RPR or revenue per email. That is how you avoid optimizing for machine opens.
Welcome email benchmarks are a definition problem before they are a performance problem. Keep GetResponse’s 83.63%, Klaviyo’s 51.26%, and Omnisend’s 35.53% in separate cells, then run the series on clicks, orders, and dollars like Omnisend’s $6.16 and Klaviyo’s $2.35 RPR. Browse the feat. marketplace if creators should sell an owned product to the same list that gets your welcome series.
Preference center best practices: CAN-SPAM menu plus stop-all, Google one-click vs body preference pages, and SendGrid's labeled 20% unsub drop.
Mailchimp vs Klaviyo: contact billing fork, send multipliers (10x/12x/15x), starting prices, and when ecommerce depth beats a general ESP.
Email list growth benchmarks: Omnisend 1.24B popup displays at 2.1%, form-type ladder, and levers that beat the average without inventing MoM %s.