Affiliate Marketing for Startups: Complete Guide
Affiliate marketing for startups is an operating system—locks, cost, recruit, rates, tracking, first 100 sales, then diagnose a flat roster.
UGC marketing benchmarks: Emplifi's 6.73x conversion and 4.11x visit lifts, steady 1.04x AOV, and how to score on-site UGC vs paid creative tests.

TL;DR: UGC marketing benchmarks are a surface-labeled scorecard. Emplifi’s Q1 2026 sample puts pages with UGC at 6.73x conversion rates and 4.11x visits versus non-UGC pages, with AOV near flat at 1.04x. Treat that as on-site proof. Paid UGC is a creative-testing volume game. Do not invent one industry ROAS.
Founders ask for UGC marketing benchmarks the way they ask for a magic ROAS. They want one multiple that proves every customer video “works.” That census does not exist. What exists is sharper: dated on-site multipliers from named platform samples, and a separate scorecard for paid creative testing.
This spoke sits next to UGC vs influencer marketing (assets versus distribution), whitelisting and Spark Ads explained, influencer marketing vs paid ads, and how brands calculate influencer marketing ROI. Community participation metrics live in community-led growth benchmarks.
UGC marketing benchmarks are labeled reference points for how user-generated or customer-looking content performs on traffic, conversion, order value, and paid creative efficiency compared with brand-only content. They come from named samples with dates and methods. They are not a guaranteed lift for your next PDP.
In practice, “UGC” covers two different inventories that share a vibe. On-site UGC is reviews, photos, shoppable galleries, and social proof embedded on pages you control. Paid UGC is commissioned creator video and native-looking ads you run from a brand or creator handle. Emplifi’s headline multiples describe content and pages tagged with UGC inside its platform sample. They do not automatically describe every TikTok Spark test you ran last Tuesday.
Do not confuse this scorecard with UGC vs influencer marketing. That article answers what dollar buys assets versus distribution. This article answers which published multipliers are defensible when someone asks “what does UGC do to conversion?” Affiliate pay-for-performance is a third path entirely (affiliate vs influencer marketing).
UGC marketing benchmarks matter because budgets follow proof, and the market still quotes undated “4x CTR” folklore. A dated multiplier with a method note beats a vibes slide. So does knowing which surface the number actually measured before you scale spend.
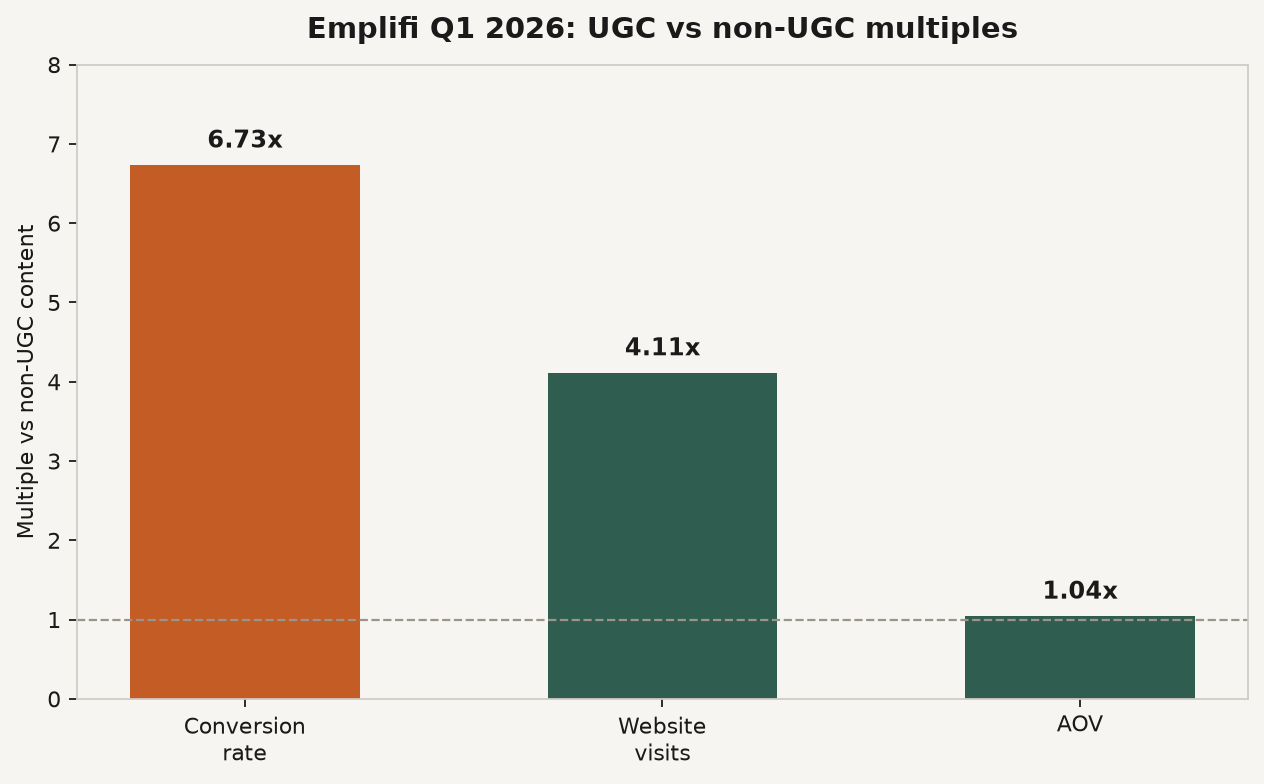
Source: Emplifi, Q1 2026 Social Media Benchmarks (Jan 1-Mar 31, 2026). https://emplifi.io/resources/q1-2026-social-media-benchmarks/
UGC marketing benchmarks work as three labeled layers: on-site multipliers from platform samples, paid creative economics from marketplace and ad studies, and your own holdout tests. Mix the layers and you will cite Emplifi’s 6.73x as if it were your cold-traffic CPA. That is how decks die in finance reviews.
| Metric (UGC vs non-UGC) | Q4 2025 | Q1 2026 | Direction |
|---|---|---|---|
| Conversion rate multiple | 4.27x | 6.73x | +57% QoQ |
| Website visits multiple | 3.83x | 4.11x | Up |
| Average order value multiple | (steady series) | 1.04x | Flat |
Source: Emplifi Q1 2026 benchmarks. Sample: thousands of U.S. brand accounts on Emplifi, Jan 1-Mar 31, 2026, normalized with minimum thresholds.
Use this table when the question is “does customer content on pages we control correlate with better visits and conversion?” Do not paste 6.73x into a paid-social forecast without your own baseline. Vendor-labeled secondary evidence points the same direction at smaller scale: Idukki reports a theater.xyz 50/50 A/B with 30,000+ visitors per arm and about +20% conversion on pages carrying its shoppable UGC (Idukki). Different method. Same sign. Still not your store.
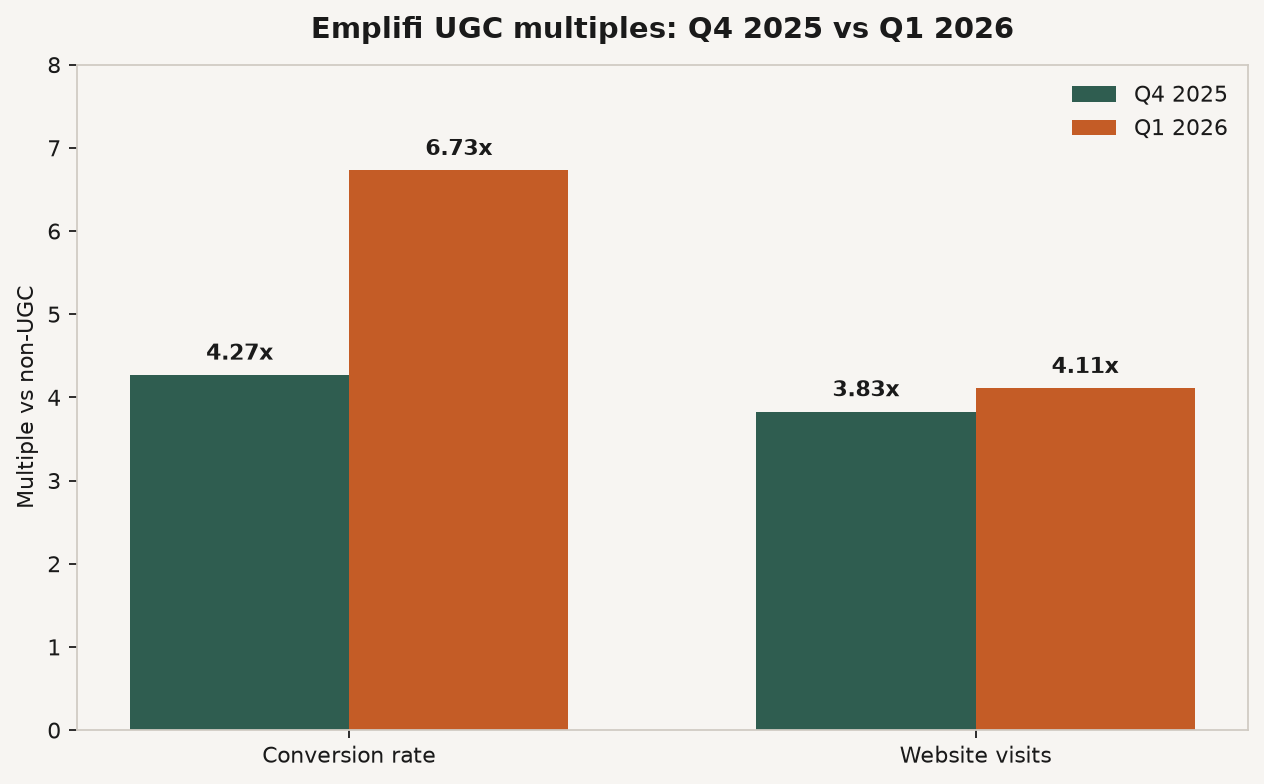
Source: Emplifi, Q1 2026 Social Media Benchmarks and press release. https://emplifi.io/press/ugc-drives-6-7x-higher-conversions-in-q1-2026/
| Signal | Q4 2025 | Q1 2026 |
|---|---|---|
| E-commerce share of Facebook interactions | 35.8% | 42.1% |
| E-commerce share of Instagram interactions | 32.6% | 37.8% |
| Facebook Feed paid CTR | 1.34% | 1.36% |
| Facebook Reels paid CTR | 0.69% | 0.74% |
Source: Emplifi.
These are not UGC-only rows. They are the environment UGC competes in. Feed still leads paid CTR. Reels improved but stayed well below Feed in this cut. If your “UGC benchmark” deck only shows Reels vanity views, you are measuring the wrong surface for most performance budgets.
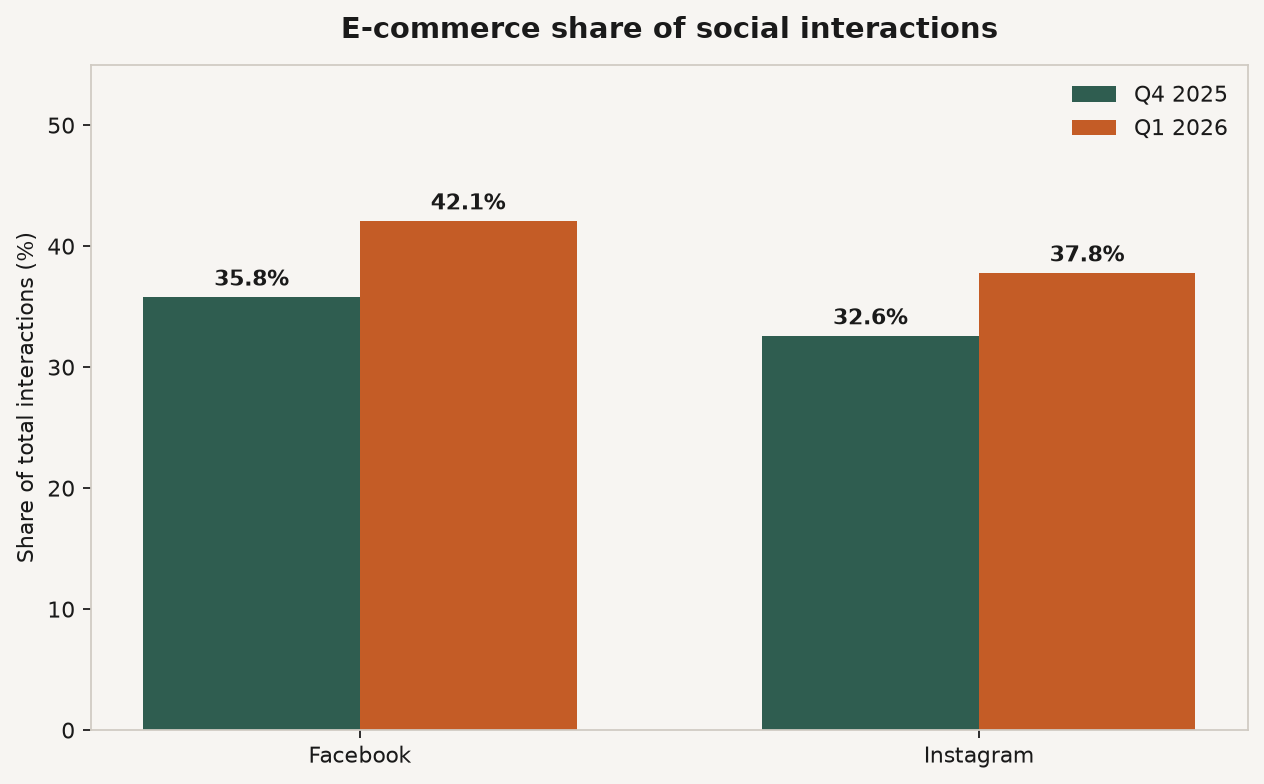
Source: Emplifi, Q1 2026 Social Media Benchmarks. https://emplifi.io/resources/q1-2026-social-media-benchmarks/
| Question | Where the number lives | Labeled figure |
|---|---|---|
| What does a marketplace UGC asset cost? | UGC vs influencer | Collabstr ask ~$180, paid ~$154; UGC campaigns 15%→35% |
| Does creator-handle paid beat brand-handle licensed UGC? | Same sibling + whitelisting / Spark Ads | Agentio: +19% CTR, +10% CVR, -5% CPA vs licensed UGC |
| How fast do winners die? | Agentio via sibling | ~36 days average; ~40 new tests/month to hold 10 winners |
| How do you score influencer ROI vs ads? | Influencer vs paid ads; influencer ROI math | Separate scorecards by horizon |
Operators on Reddit keep restating the operating truth in plain language: stop optimizing cost per video alone; optimize cost per winning creative (r/AI_UGC_Marketing). Cold-traffic conversion anecdotes (0.1% to 0.4% view-to-signup in one public thread) are not a census. They are a warning that reach without a landing-page and offer scorecard will burn cash (r/Entrepreneurs).
Build a UGC benchmark scorecard by separating on-site proof from paid creative tests, logging labeled baselines, and refusing one blended ROAS myth. Five steps follow. Each step is a measurement decision you can defend in a finance review, not a content idea brainstorm.
Q: What are UGC marketing benchmarks? A: They are dated, labeled figures for how user-generated or customer-looking content performs on visits, conversion, order value, and paid creative efficiency versus brand-only content. Emplifi’s Q1 2026 sample is one primary source for on-site multipliers. Your holdout tests remain the operating truth.
Q: What is a good UGC conversion rate? A: There is no single public census rate for every store. Emplifi reports UGC content at 6.73x the conversion rate of non-UGC content in Q1 2026, which is a relative multiple, not your absolute CVR target. Measure your own baseline pages first.
Q: Do UGC ads always beat polished studio ads? A: Not as a universal law. Many operators report native-looking UGC winning on CTR and CPA in split tests, but there is no public dataset proving one ROAS winner across every category. Run your own creative tests and track cost per winner.
Q: How should I use Emplifi’s 6.73x figure in planning? A: Use it as industry context for on-site UGC impact, note the Q4-to-Q1 move from 4.27x to 6.73x, and pair it with your PDP holdout. Do not paste it into a paid-social forecast as if it were your Meta CPA.
Q: Is UGC the same as influencer marketing? A: No. UGC in the paid-creator sense usually buys reusable assets for channels you control. Influencer marketing buys distribution on someone else’s audience. See UGC vs influencer marketing for the job fork and marketplace pricing.
UGC marketing benchmarks stay useful when labeled by surface. Emplifi’s Q1 2026 scorecard puts UGC pages at 6.73x conversion and 4.11x visits, with AOV near 1.04x. Paid UGC still lives on testing volume and rights. If you built a product people will recommend, list it on feat. and let affiliates sell it through co-branded storefronts.
Affiliate marketing for startups is an operating system—locks, cost, recruit, rates, tracking, first 100 sales, then diagnose a flat roster.
Build a commission-based sales network as a single-tier seller graph—economics, surface, named sellers, then density. Rewardful: only 1.28% of affiliates sell.
Build a product distribution network on four rails—DTC, wholesale, commission sellers, co-branded storefronts. Densify before you scale; Lowe’s pays up to 20% on storefronts.