How Much Stock Loss Is Normal on a Creator Campaign
Most marketers see under half of gifted creators post. Plan stock loss as majority silent inventory, then cut ghosts with opt-in and prune rules.
IPA data: influencer marketing vs paid ads shows short-term ROI index 99 vs paid social 86, and long-term 151 vs 77. Pick by job, not hype.

TL;DR: Influencer marketing vs paid ads is a job split, not a religion. IPA’s 2025 Influencer Database puts short-term influencer ROI near the all-channel average (index 99 vs 100) and ahead of paid social (86). Long-term, influencers score 151 versus paid social at 77, with the highest long-term multiplier studied (3.35). Pick by the outcome you need and the measurement you trust.
Marketers keep asking whether influencer marketing beats paid ads. The wrong answer is a recycled “$5.78 for every dollar” line treated as a 2026 law. The right answer starts with the job: harvest intent, create demand, or do both with creator assets in paid media.
Influencer marketing vs paid ads only becomes useful when you separate sales contribution from ROI indexes, short-term from long-term, and clicks from brand memory. The IPA’s first cross-industry Influencer Database finally gives that comparison a public spine.
Key takeaways:
Influencer marketing vs paid ads is the comparison between buying creator partnerships (sponsored posts, ambassadors, affiliate-hybrid deals, UGC licenses) and buying media inventory through ad platforms (Meta, Google, TikTok ads, and similar auction or reserved placements).
They are not clean opposites. Creator content often becomes paid ads through whitelisting, Spark Ads, and dark posts. Affiliate and co-selling sit nearby when pay is tied to tracked sales rather than a flat fee (see affiliate vs influencer marketing).
Paid ads rent attention at a bid. Influencer deals rent (or partner with) a person’s trust and format. Your spreadsheet should say which job you hired.
Wrong framing wastes budget in both directions. You either kill a creator program because last-click ROAS looked soft, or you refuse paid media because a case study claimed creators “always” win.
Why the comparison matters:
Paid ads win when you need controllable reach against existing demand and clean bid feedback loops. Influencer partnerships win when you need trust, memory, and long-horizon payback that click models miss. The IPA indexes are the comparison spine: short-term influencers near channel average and ahead of paid social; long-term influencers clearly ahead of paid social on ROI index and multiplier. Hybrid setups (creator assets in paid) often capture both.
Treat these as indexed effectiveness scores from IPA’s Influencer Database, not as “dollars back per dollar” ROAS from your ad account.
| Metric | Influencer | Paid social | Linear TV | All-channel avg | Sample note |
|---|---|---|---|---|---|
| Short-term ROI index | 99 | 86 | 97 | 100 | 59 UK campaigns (unless stated) |
| Short-term sales contribution | 4.5% | 13% | 32% | n/a | Same short-term cut |
| Long-term ROI index | 151 | 77 | n/a | n/a | 18 UK campaigns |
| Long-term sales contribution | 6.2% | n/a | n/a | n/a | 18 UK campaigns |
| Long-term multiplier | 3.35 | n/a | 3.27 | n/a | Highest of channels studied (influencers) |
Source: IPA, Oct 8, 2025. Also summarized by Marketing Week.
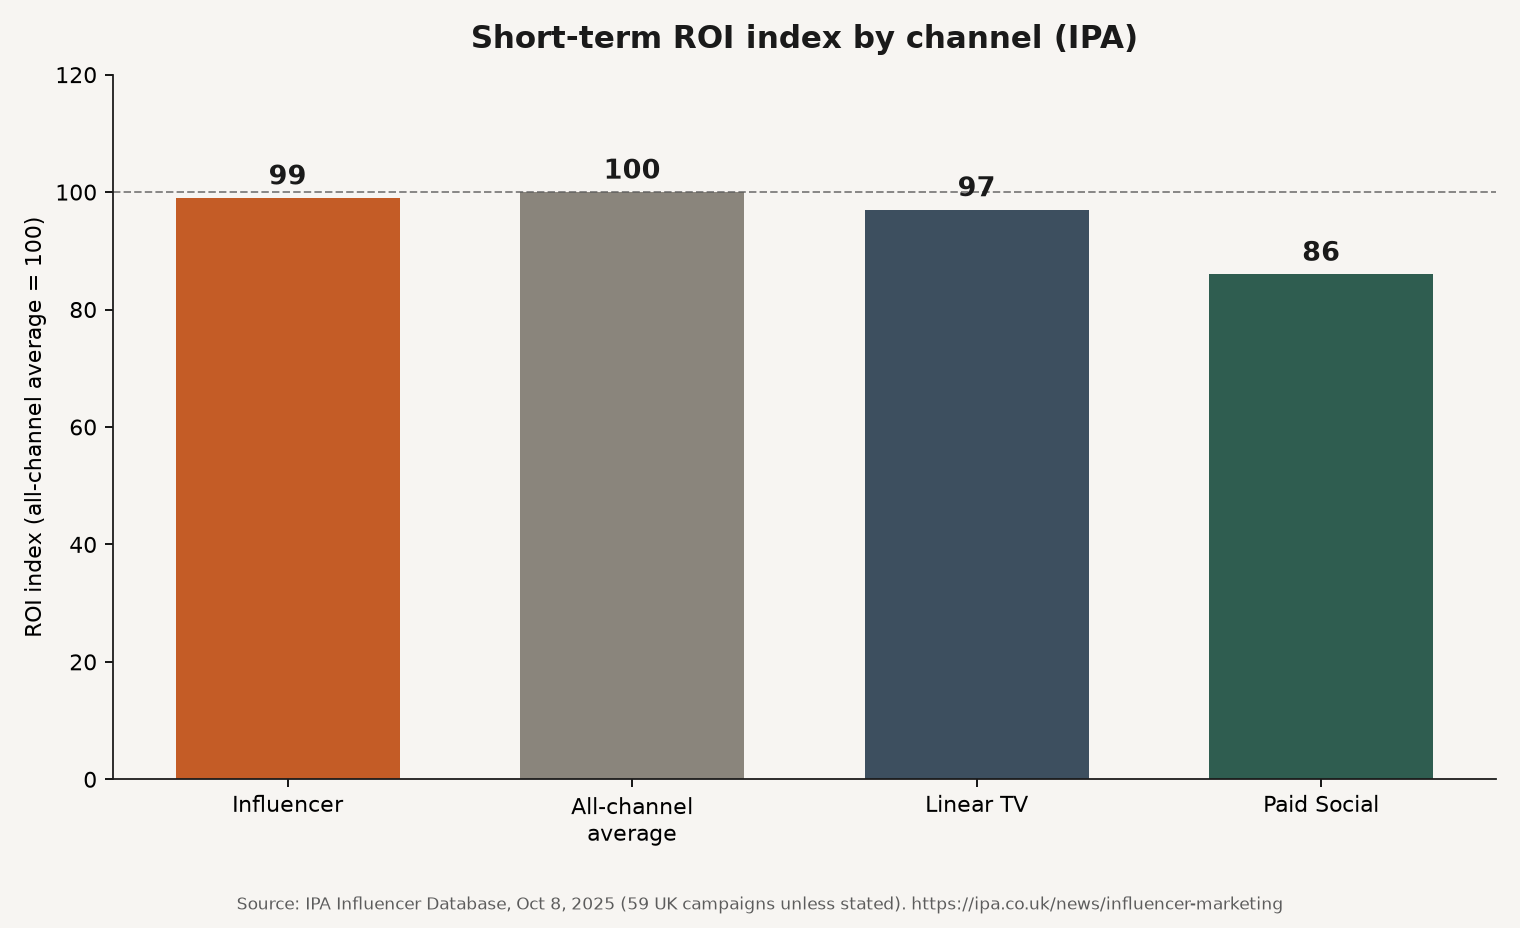
Source: IPA, First-of-its-kind IPA data details strong ROI and long-term impact of Influencer Marketing, Oct 8, 2025. https://ipa.co.uk/news/influencer-marketing
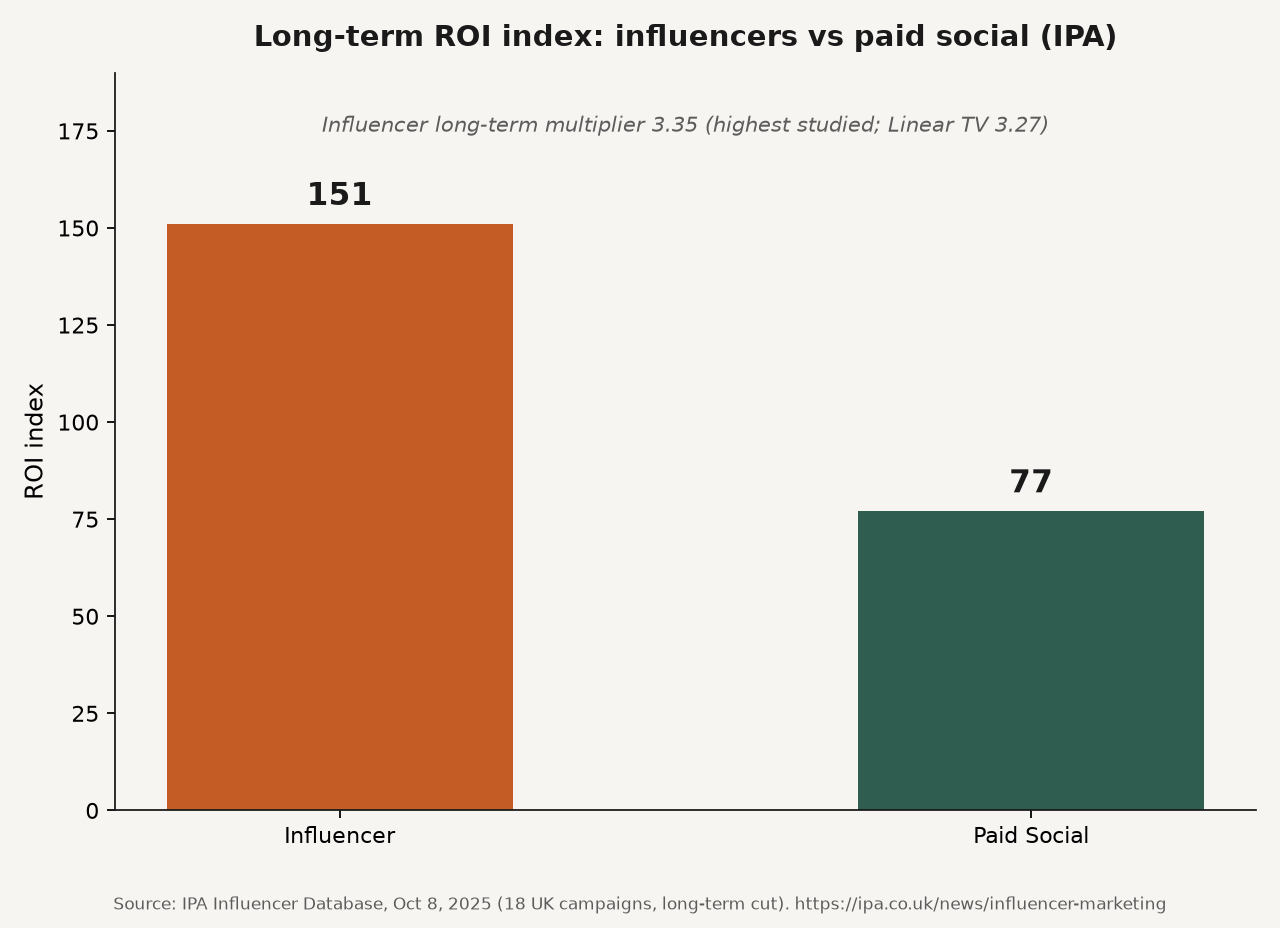
Source: IPA, Oct 8, 2025 (18 UK campaigns for long-term cut). https://ipa.co.uk/news/influencer-marketing
Paid ads (platform media). Best when intent already exists or you can define a tight conversion event. You control budget pacing, audiences, and creative tests daily. Weakness: rising costs, creative fatigue, and measurement that over-credits the last click. Paid social still contributed more short-term sales share in IPA’s cut (13%) even with a lower ROI index than influencers (IPA). Volume and efficiency are different questions.
Influencer / creator partnerships. Best when you need a trusted narrator, category education, or memory that lasts past the attribution window. IPA’s long-term index and 3.35 multiplier are the commercial case (IPA). Weakness: variance. Bad fit kills the line item. IPA explicitly ties outcomes to fit and creative quality more than spend levers.
Hybrid (creator as media). License or whitelist creator assets into paid. You keep the trust signal and add auction scale. Treat production, usage rights, and media as separate cost lines on your influencer ROI scorecard.
Affiliate-shaped creator deals. When you want pay-for-performance instead of (or beside) flat fees, you are in commission territory. That is a risk allocation choice, not a substitute for brand-building creators (affiliate vs influencer marketing).
Use these as supporting color. They are agency or platform samples, not a public census of every brand.
Do not average these into a fake industry ROAS.
| If the job is… | Lean paid ads when… | Lean influencers when… | Mix / hybrid when… |
|---|---|---|---|
| Harvest intent | Search/social capture converts today | Creators educate a confused category first | Use creators for proof, ads for retargeting |
| Scale this week | Auction budgets and creative tests are ready | You cannot buy meaningful trust with a small media check | Whitelist winning creator posts into paid |
| Long-term brand equity | You already have distinctive brand assets in market | You need IPA-style long-horizon payback and memory | Always-on ambassadors plus always-on media |
| Measurement maturity | You only trust platform ROAS dashboards (know the bias) | You will fund MTA/MMM/lift, not only last-click | Run incrementality on both |
| Creator tier choice | N/A (buy audiences) | Nano/micro for efficient seeding; macro for attention (micro vs macro ROI) | Tier portfolio, not one mega bet |
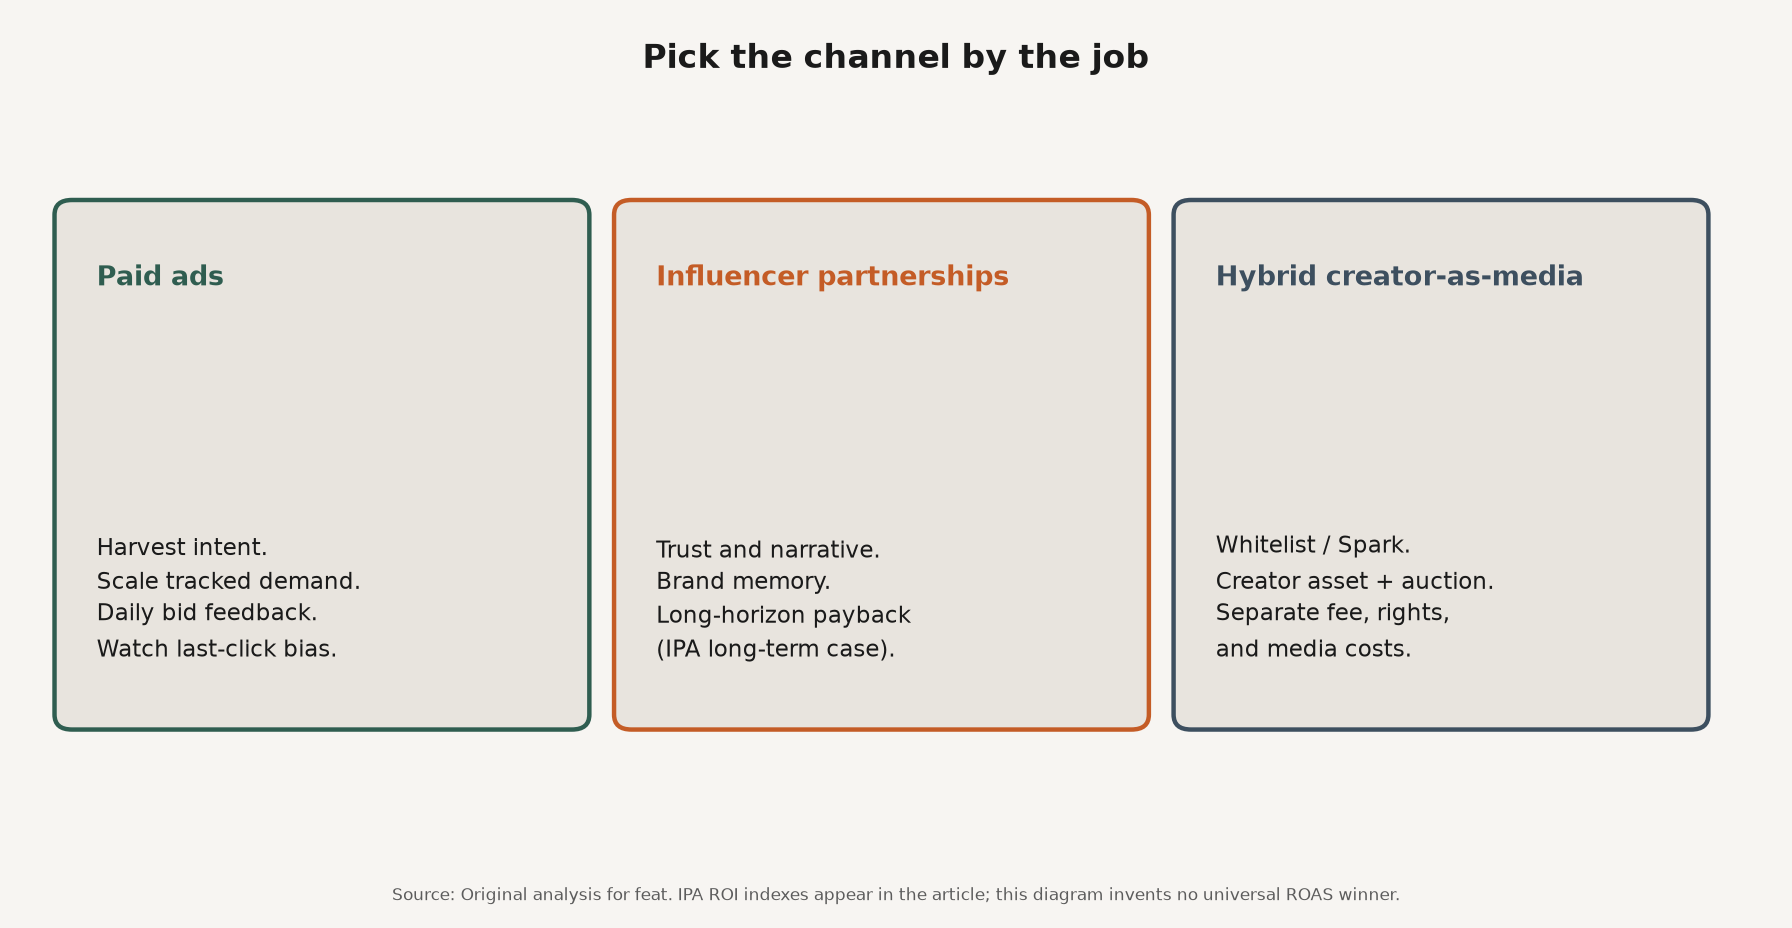
Source: Original analysis for feat. IPA ROI indexes and sample sizes cited in the article; this diagram invents no universal ROAS winner.
In r/influencermarketing threads comparing 2025 effectiveness, the recurring split is blunt: paid ads still win predictable short-term conversion and scale; creators win trust and demand creation; the highest ROI often appears when influencer content powers the paid engine (r/influencermarketing). Treat that as demand language. It matches the IPA short-term versus long-term pattern better than any single viral ROAS screenshot.
Q: Does influencer marketing outperform paid ads on ROI? A: On IPA’s UK cuts, influencers beat paid social on short-term ROI index (99 vs 86) and more clearly on long-term ROI index (151 vs 77). That is not a promise for every niche or budget. Paid social still contributed a larger short-term sales share (13% vs 4.5%).
Q: What is the difference between influencer marketing and paid social ads? A: Influencer marketing buys a creator partnership and narrative. Paid social buys auction or reserved inventory on a platform. Creator assets can become paid social through whitelisting or Spark Ads, which is a hybrid, not a third religion.
Q: Why can influencers show strong ROI with a smaller sales contribution? A: ROI indexes relate return to cost. Sales contribution is the channel’s share of sales in the study cut. IPA’s influencers posted a high index with 4.5% short-term sales contribution while paid social posted 13% contribution with a lower index. Efficiency and volume are different questions.
Q: How should I measure influencer marketing vs paid ads fairly? A: Define the horizon first. Use multi-touch or MMM for assists, and incrementality tests when you need causal lift. Do not crown a winner from last-click ROAS alone. See attribution models compared and incrementality testing explained.
Q: Is there one ROAS number that proves influencers always win? A: No. There is no public universal table that settles every category. IPA provides indexed channel comparisons with stated sample sizes. Whalar’s $2.41 MMM figure and Kantar creative outperformance rates are useful secondaries from specific programs, not a law for your forecast.
Influencer marketing vs paid ads is a portfolio decision. IPA’s 2025 database puts creators near the short-term channel average and clearly stronger than paid social on long-term ROI index and multiplier. Paid media still scales tracked demand when intent is hot. Fit, creative quality, and honest measurement decide whether your creator line looks like IPA’s upside or like expensive noise.
If you want creators selling with tracked storefronts rather than only flat-fee posts, browse products on the feat. marketplace.
Most marketers see under half of gifted creators post. Plan stock loss as majority silent inventory, then cut ghosts with opt-in and prune rules.
UGC vs influencer marketing is assets vs distribution. Collabstr UGC ~$154 paid; Agentio shows Partnership Ads beat licensed UGC on CTR, CVR, and CPA.
Influencer contract terms explained: usage, exclusivity, whitelisting, kill fees, payment, and FTC disclosure, plus a brand vs creator negotiation matrix.