Product Quiz Conversion Rate Benchmarks (2026)
Product quiz conversion rate benchmarks are a Quiz Denominator Ladder: RevenueHunt 5.5% of completers; ConvertFlow 5.2% of viewers. Not sitewide CVR.
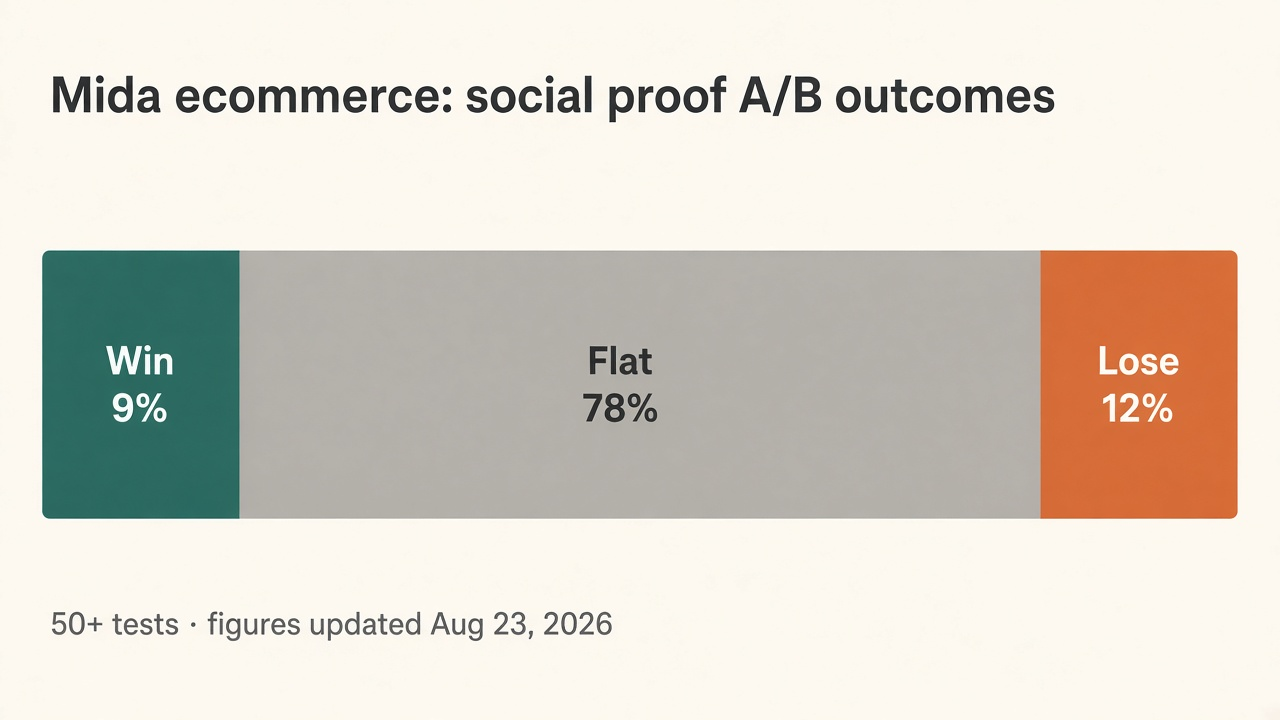
Social proof conversion lift: Mida finds only 9% of ecommerce social-proof A/Bs beat control (78% flat, 12% lose). Separate from review presence ladders.

TL;DR: Social proof conversion rate lift is a Win-Rate Ladder, not a guaranteed multiplier. Mida’s ecommerce panel (50+ social-proof A/B tests; figures updated August 23, 2026) finds only 9% beat control, 78% show no measurable change, and 12% lose — with 82% of those tests measured against purchase. Separate that base rate from review-presence ladders on the product reviews spoke.
Merchants Google social proof conversion rate lift and get a slide that says “proof converts.” The deck then pastes Spiegel’s 270%, Emplifi’s 6.73x, and a fake “people buying now” counter into one cell. Those are different jobs. Treating them as one lever is how you ship a widget and call quiet A/B results a traffic problem.
Social proof conversion rate lift matters when you decide whether to buy another urgency app, redesign trust seals, or keep funding review collection. This page sits next to product reviews conversion rate impact, ugc marketing benchmarks, cart abandonment rate reasons and fixes, and checkout conversion rate benchmarks.
Social proof conversion rate lift is the measured change in a conversion metric when you add, move, or remove signals that other people bought, rated, endorsed, or trusted a product — relative to a control without that change.
It is an experiment grammar, not a vibes category. Mida counts tests that change testimonials, star ratings, customer logos, user counts, or review snippets (Mida). That includes some review UI tests. It does not replace the PowerReviews / Spiegel presence and volume meters owned on product reviews conversion rate impact. It also does not replace Emplifi’s page-content multiples on ugc marketing benchmarks.
Operators mash three jobs. First is presence: empty PDP versus reviewed PDP. Second is experiment win rate: how often a social-proof variant beats control. Third is trust repair: payment anxiety and seals at checkout. This article owns the second, with the third as context. The first stays on the reviews spoke.
Finance will not fund another FOMO app on a case study screenshot. You need a base rate before you promise a lift.
Social proof conversion rate lift works when you separate A/B base rates from review-presence studies, label the outcome metric, and treat trust seals as a checkout job. Quote Mida’s 9 / 78 / 12 before you quote a single winner case study.
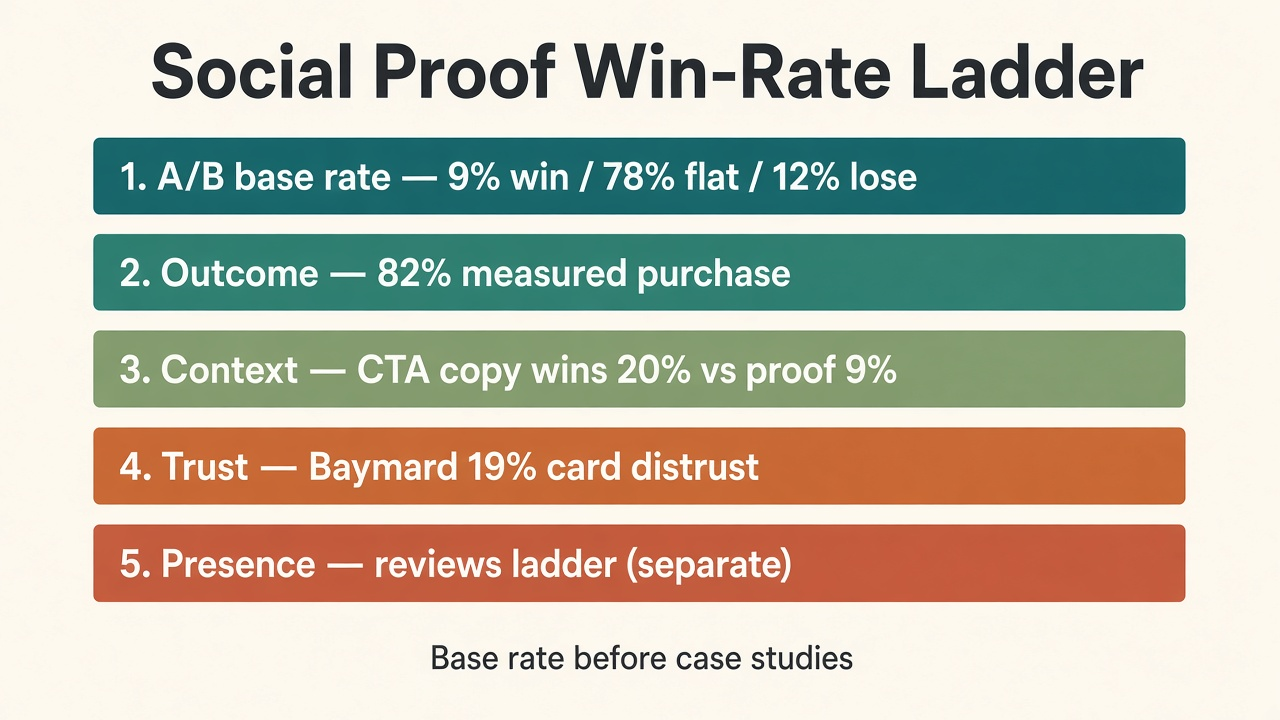
| Rung | What you measure | Labeled public anchor | Decision |
|---|---|---|---|
| 1. Experiment base rate | Share of social-proof A/Bs that beat control | Mida ecommerce 9% win / 78% flat / 12% lose (50+ tests) | Budget for flat; require a test |
| 2. Outcome quality | Soft click vs purchase | 82% of classified tests measured purchase | Prefer order-complete goals |
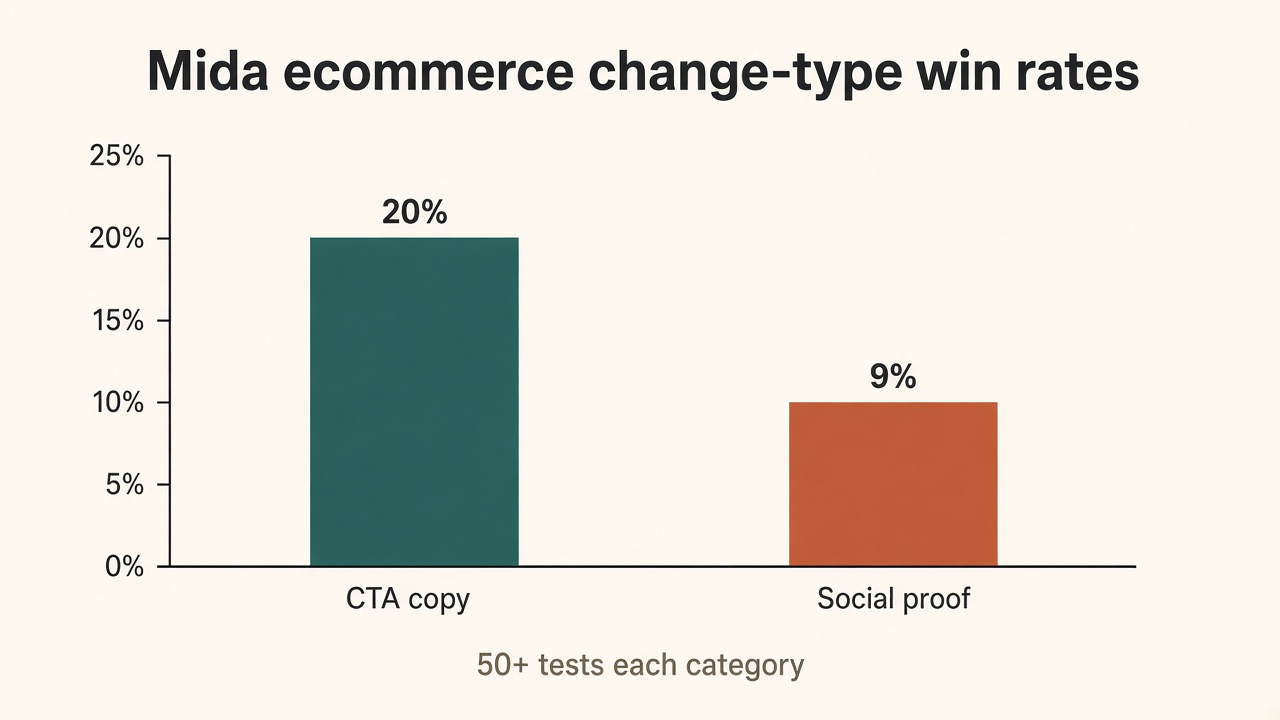
| 3. Change-type context | Social proof vs other CRO levers | CTA copy 20% win rate vs social proof 9% | Prioritize copy before widgets |
| 4. Trust abandon | Payment anxiety | Baymard 19% didn’t trust site with card (2025, n=1,026) | Fix checkout trust separately |
| 5. Presence ladders | Review volume / interaction | PowerReviews / Spiegel on reviews spoke | Link out; do not mash into win rate |
Sources: Mida; Baymard perceived security; product reviews.
Source: Mida ecommerce social proof benchmarks (updated Aug 23, 2026); Baymard Checkout Usability 2025. https://www.mida.so/industries/e-commerce/social-proof; https://baymard.com/research-articles/perceived-security-of-payment-form.
Mida’s ecommerce row is the citable floor for “will this social proof test win?” Only about 9% of readable tests beat control. The 95% interval runs roughly 5% to 17%, so treat 9% as directional (Mida). Median traffic per variant sat near 3,998 visitors. Tests clustered on product pages (40), then homepages (23), then other pages (14).
All-industries social proof wins about 8% on 100+ tests. Ecommerce is not magically kinder to proof widgets (Mida).
Mida is explicit that win-rate tables are not like-for-like rankings: proxy goals win more often (13%) than business outcomes (9%) across their data. Hold the metric fixed and category gaps shrink. Read 9% as a base rate description, not a leaderboard score (Mida).
Source: Mida, figures updated August 23, 2026. https://www.mida.so/industries/e-commerce/social-proof.
Mida’s illustrative winners include clearer shipping/returns/guarantee points, clearer BNPL messaging, and rating list items inside better information architecture — lifts on those single-site tests ranged from roughly +28.9% to +77.2% on their primary goals (Mida). Those are anecdotes, not a census of winners.
Illustrative flats include random viewer/cart-count widgets and cosmetic badge restyles with no significant difference (Mida). If your “social proof” is a fake scarcity counter, expect the 78% bucket.
Baymard’s 19% “didn’t trust the site with my credit card information” reason is about payment anxiety, visual security of the card form, and recognizable seals — not about a homepage logo wall (Baymard). Pair that with checkout conversion benchmarks and cart abandonment reasons. Do not cite 19% as proof that every testimonial carousel lifts sitewide CVR.
Source: Mida ecommerce change-type table, updated August 23, 2026. https://www.mida.so/industries/e-commerce/social-proof.
Product reviews conversion rate impact owns PowerReviews presence/interaction/volume and Spiegel’s first-five 270% grammar. UGC marketing benchmarks owns Emplifi page multiples. This page owns experiment base rates for the social-proof change type. Link across the cluster. Do not average them into one fake lift.
Run this sequence before you buy another proof tool. Each step is at most two sentences.
Q: What is a realistic social proof conversion rate lift? A: Start with Mida’s ecommerce base rate: about 9% of social-proof A/B tests beat control, 78% are flat, and 12% lose (50+ tests). When a test wins, the lift is site-specific — Mida does not publish a median lift for winners on that page.
Q: Do social proof A/B tests usually increase conversion? A: Usually not in a measurable way. Flat is the mode. Plan implementation cost against an expected flat result, then keep winners that clear purchase goals.
Q: How is social proof conversion lift different from product review impact? A: Review-presence studies (PowerReviews, Spiegel) measure what happens when ratings exist and get used on a PDP. Social-proof win rates measure how often changing a proof element beats a control in an A/B test. Link both; do not average them.
Q: Should I add trust badges for conversion? A: Treat badges as part of checkout trust repair when Baymard-style card anxiety shows up (19% named that abandon reason in 2025). Do not assume a homepage seal wall inherits the same lift as a payment-form seal test.
Q: Can I quote one industry “social proof lifts conversion by X%” number? A: No. There is no public dataset that cleanly pools testimonials, live counters, logos, and review widgets into one lift law. Quote Mida’s win-rate split or a labeled single experiment instead.
Social proof conversion rate lift rewards honesty about base rates. Mida’s ecommerce panel says only about 9% of social-proof tests beat control while 78% flatline and 12% lose — mostly on purchase goals. Review presence and UGC page multiples remain sibling meters, not substitutes. Baymard’s 19% trust-card abandon is a checkout trust job. The “social proof always converts” slide was never a 2026 planning law.
If you want distribution that already converts attention into affiliate-sold storefronts, list on feat..
Product quiz conversion rate benchmarks are a Quiz Denominator Ladder: RevenueHunt 5.5% of completers; ConvertFlow 5.2% of viewers. Not sitewide CVR.
Size guide conversion rate impact is a Size Confidence Ladder: Baymard 83%/87% fail sufficiency; Snipes Fit Finder +3% all-traffic vs a static chart.
Sticky add to cart conversion lift: Vitals 9.3% of orders involve the bar; Growth Rock +7.9% desktop vs scroll-to-section with no order lift.