Product Quiz Conversion Rate Benchmarks (2026)
Product quiz conversion rate benchmarks are a Quiz Denominator Ladder: RevenueHunt 5.5% of completers; ConvertFlow 5.2% of viewers. Not sitewide CVR.
Sticky add to cart conversion lift: Vitals 9.3% of orders involve the bar; Growth Rock +7.9% desktop vs scroll-to-section with no order lift.

TL;DR: Sticky add to cart conversion lift is an Action Proximity Ladder, not a 5–26% app-store slogan. Vitals’ 2026 census puts the bar in 9.3% of median-store orders — involvement, not incrementality. Growth Rock’s desktop buy box added 7.9% completed orders; the mobile scroll-to-section variant added clicks and no order lift. This is not add to cart rate by niche.
Merchants Google sticky add to cart conversion lift and get a mashup: a Shopify app quoting 9.3% of orders, a supplement test at +7.9%, a parts catalog at +25.95%, then a Reddit post that “nearly doubled.” Finance averages them. You pin a footer bar on every short visual PDP and wonder why mobile reviews disappeared under a button.
Sticky add to cart conversion lift matters when you decide whether the bar can finish the buy — variants, price, and all — at the moment the native button has left the screen. This page sits next to add to cart rate benchmarks by niche, product page conversion rate benchmarks, mobile vs desktop conversion, and cart abandonment rate reasons.
Sticky add to cart conversion lift is the causal change in completed orders — or revenue per visitor — when a persistent add-to-cart control stays on screen after the native buy box scrolls away, measured against a holdout that does not get that control.
It is not session add-to-cart rate. Add to cart rate by niche already owns Littledata’s session medians (Beauty 14% → Home 4.5%; all-store 6.5%). A sticky bar’s add-to-cart rate is usually add-to-carts from the bar ÷ bar impressions. Those denominators do not commute.
It is also not “share of orders involving the bar.” Vitals counts an order as involved when the shopper clicked the bar in the same cart session within 30 days. That is attribution. Incrementality is what Growth Rock measured: more completed orders with the sticky control than without it (Growth Rock).
The useful name for the job is action proximity. Blend’s user tests called it an action proximity gap: intent forms in specs and install notes while the purchase control has left the viewport (Blend Commerce). A bar that closes that gap without covering the evidence that created the intent is a lift candidate. A bar that only scrolls you back to a size dropdown is a click generator.
Wrong meters buy the wrong bar. You celebrate extra add-to-carts, raise cart abandonment, then treat Vitals’ 9.3% involvement as booked revenue. Sticky add to cart conversion lift only matters if the persistent control can finish the purchase at the moment intent arrives — and if you score orders, not taps.
Sticky add to cart conversion lift works when you name the meter (orders or revenue per visitor, not bar clicks), name whether the bar can complete the variant job, and refuse to treat Vitals’ 9.3% involvement as a lift you can book.
| Rung | What you measure | Labeled public anchor | Decision |
|---|---|---|---|
| 1. Involvement (Vitals) | Orders / revenue where the bar was clicked in-session | Median 9.3% of orders, 9.7% of revenue; top 10% 25.2% / 25.8% | Usage, not incrementality |
| 2. Bar efficiency (Vitals) | Clicks and ATCs ÷ impressions | Click 1.6% median (top 25% 3.3%); ATC/impression 1.2% (top 25% 2.6%); click-to-cart 80.5% | Diagnose placement before you claim lift |
| 3. Incrementality, complete job (Growth Rock) | Orders with sticky buy box vs not | Desktop +7.9% orders / +8.6% ATC; mobile drawer +5.2% orders / +11.8% ATC | Test a control that can finish the buy |
| 4. Incrementality, incomplete job (Growth Rock) | Same retailer, scroll-to-section sticky | +6% ATC clicks; no significant order lift | Extra clicks can raise abandonment, not revenue |
| 5. Research-heavy desktop (Blend) | Single-store CVR / RPV | +25.95% CVR, +25% RPV, +6.3% AOV on a specs-heavy PDP | Ceiling anecdote; unpublished n |
| 6. Sticky-CTA win rate (Online Dialogue) | Winners among sticky elements, not ATC-only | 27% of 33 (9 / 6 / 18); PDP 25%; cart/checkout 100%; home/PLP 0% | Do not paste cart-page wins onto a PDP |
Sources: Vitals 2026; Growth Rock; Blend Commerce; Online Dialogue 2023.
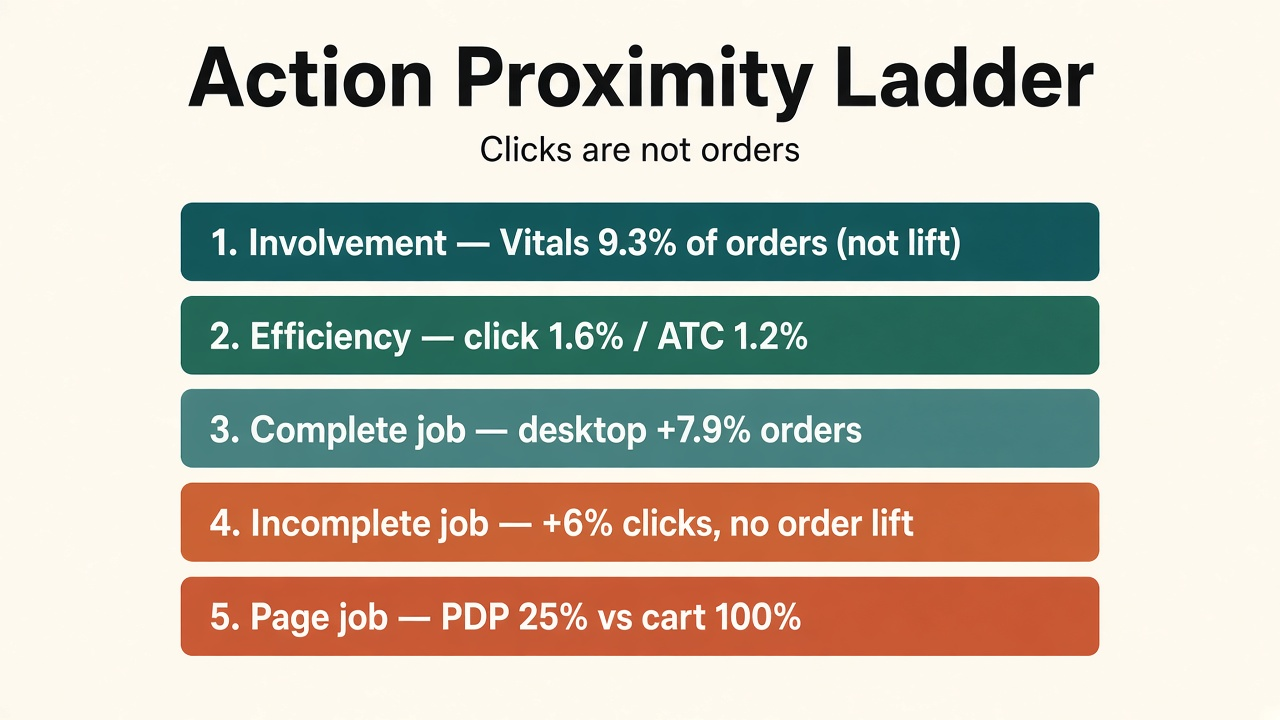
Source: Vitals 2026; Growth Rock; Blend Commerce; Online Dialogue 2023. URLs in the table.
Vitals’ 2026 table is the honest Shopify census, and it is still the wrong slide if your CFO hears “plus nine percent conversion.” The median store’s bar is in almost one order in ten. The top tenth puts it in one in four. Revenue tracks orders: 9.7% versus 9.3%, so involved orders are not a cheap-SKU ghetto (Vitals).
Size and price change the click, not the definition. Stores under 10 orders a month sit at 0.7% median click and $30 per 1,000 impressions. Stores at 1,000+ orders sit at 2.7% click and $266. Sub-$30 AOV clicks at 2.5%; $200+ AOV clicks at 0.8% and still earns $280 per 1,000 impressions (Vitals). Shopify Plus is the surprise: 1.2% click and 5.1% of orders versus Basic’s 1.6% and 10.1% — Vitals’ guess is that large brands already keep the native button reachable. Dawn versus other themes: both 1.2% ATC per impression. Theme is not the lever.
Vitals cannot publish a device split. That cell is no public dataset. Do not invent one from mobile vs desktop conversion.
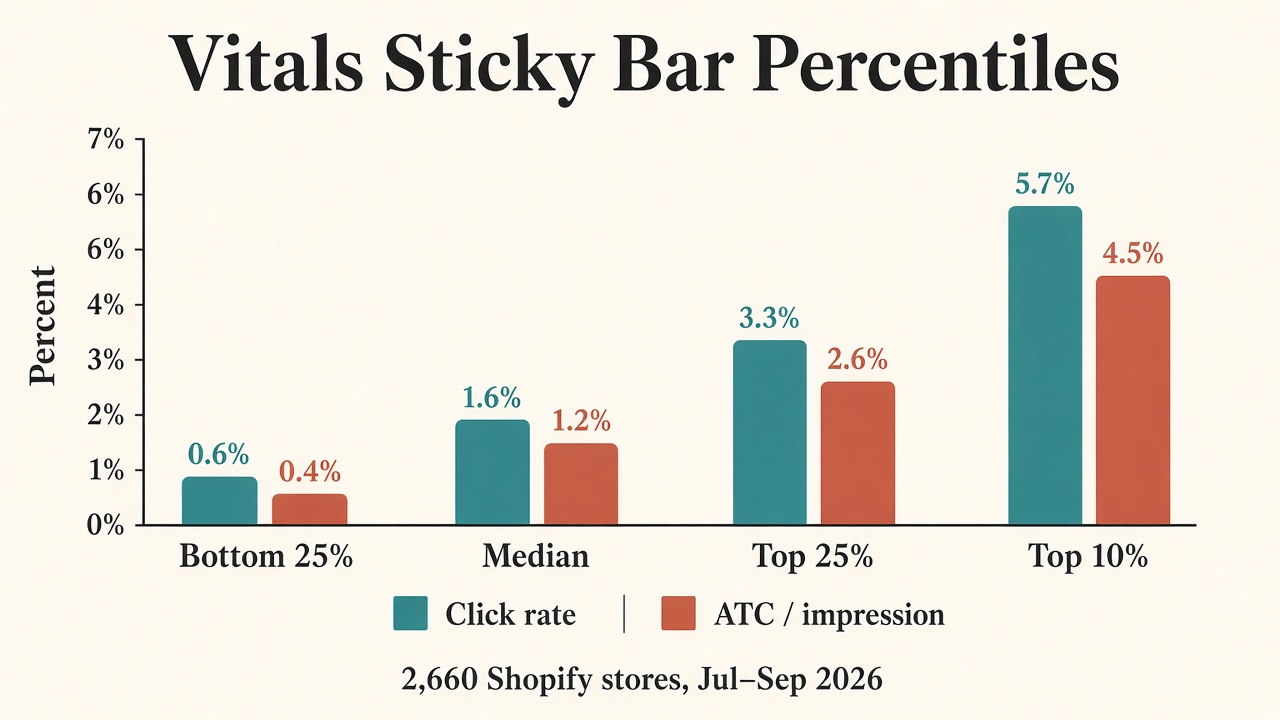
Source: Vitals Sticky Add to Cart Statistics 2026. https://vitals.app/blog/sticky-add-to-cart-statistics.
Growth Rock asked the two questions that should be on every sticky-ATC brief: does stickiness change add-to-cart, and do those extra carts become orders? On desktop, both moved together (+8.6% ATC, +7.9% orders, 99% significance, ~2,000 orders per cell). Their $790,000 line is an illustration for brands doing $10 million or more from desktop product-page traffic, not a market forecast (Growth Rock).
Mobile split the fork. Variation C — a sticky control that slid the buy box up as a drawer — took +11.8% add-to-cart clicks and +5.2% orders (>3,000 orders per variation, 14 days). Variation B — a sticky control that only scrolled the shopper back to the on-page buy box — took +6% clicks and no order lift. Growth Rock’s own read: the drawer kept people inside the selection step; the scroll-back dumped them onto the same long PDP (Growth Rock).
That is why Traction’s +2.74% at 82.7% probability belongs on a lower rung, not in an average with +25.95%. The New Zealand mobile test still made shoppers scroll back for size or flavour. Traction then quotes 5–15% “consistent with studies from the Baymard Institute.” There is no public dataset from Baymard for a sticky-ATC lift band. Cut it (Traction Marketing).
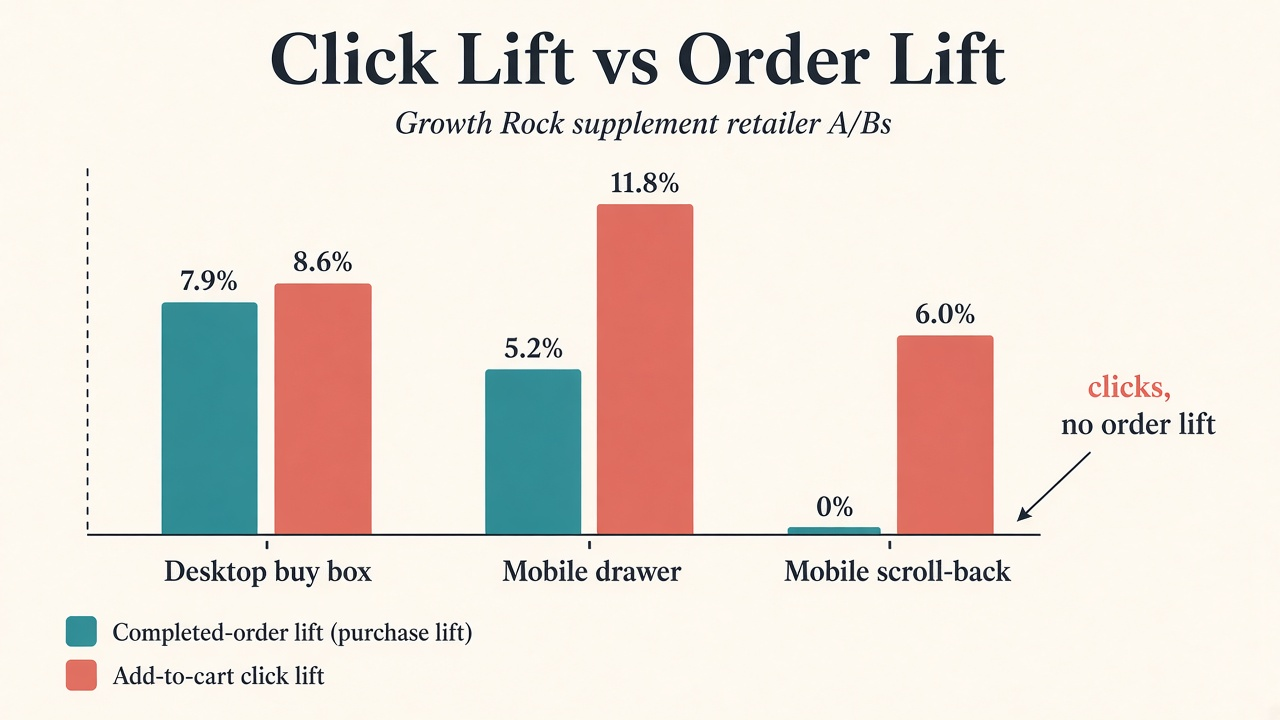
Source: Growth Rock sticky add to cart A/B tests. https://growthrock.co/sticky-add-to-cart-button-example/.
App stores sell sticky bars as a mobile fix. The best-documented order lifts in this file happened on desktop, on long evaluation pages. Blend’s PerTronix shoppers disappeared into specs and install guides; the native ATC left with them. A persistent bar returned +25.95% conversion, +14.76% add-to-cart clicks, +18.69% products per visitor, and +6.3% AOV. Sample size and significance are unpublished — treat it as a labeled ceiling, not a planning median (Blend Commerce).
Online Dialogue’s sticky-CTA meta (menus, headers, filters, not just ATC) still helps the page-job argument: cart and checkout sticky elements won 100% of their tests; homepage, listing, and promo pages won 0%; product-detail pages won 25% overall and 50% in the device-split cut. Mobile win rate 29% versus desktop 15% (transactions-only 33% versus 22%). Bottom placement won 36%, and those winners were mobile; side placement’s device-only winners were desktop (Online Dialogue). Do not paste a checkout sticky-CTA win onto a PDP bar.
CleanCommit’s later swatch test (+14% after replacing dropdowns with tappable sizes) is one agency run with unpublished n. Samuel Hess’s 12.5% win rate across 16 sticky-ATC tests is a LinkedIn census cited second-hand. Keep both off the primary table (CleanCommit).
Shopify operators already refuse the slogan. “We’ve seen both layouts win, sticky and non-sticky.” Duplicate the theme. Split traffic. Watch AOV, not only conversion (r/shopify).
Test sticky add to cart conversion lift as a holdout on completed orders, not as a theme toggle you ship everywhere. Duplicate the template, split mobile from desktop, and kill the bar if it cannot finish variants without a scroll-back. Each step below is at most two sentences.
Q: What is a good sticky add to cart conversion lift in 2026? A: There is no public Shopify-wide order-lift census. Plan from labeled rungs: Vitals median involvement 9.3% of orders (not lift), Growth Rock desktop +7.9% orders, mobile drawer +5.2%, and scroll-to-section with no order lift. Blend’s +25.95% is one research-heavy desktop store.
Q: Does sticky add to cart increase Shopify conversion rate? A: Sometimes, when the bar completes the variant job on a page where the native button leaves the screen. Growth Rock’s drawer did; the scroll-to-section control did not. Vitals’ 9.3% is how often the bar is in the order path, not how much conversion rose.
Q: Why did sticky add to cart raise clicks but not orders? A: The control probably bounced people back to a buy box they still had to configure, or it covered the proof that created intent. Growth Rock measured +6% add-to-cart clicks with a non-significant order change on that exact pattern. Extra carts with no extra purchases raise abandonment, not revenue.
Q: How long should a sticky add to cart A/B test run? A: Growth Rock’s published order tests ran 14 days at roughly 2,000–3,000 orders per variation. Traction’s +2.74% at 82.7% probability on a 10,000+ conversion/month store is the cautionary underpowered cell — do not call it a win.
Q: Can I quote 9.3% as the conversion lift from a sticky add to cart bar? A: No. 9.3% is Vitals’ median share of orders that involved a bar click in the same cart session. Vitals says the data does not show how many of those orders would have happened without the bar. Involved ≠ incremental.
Sticky add to cart conversion lift is a proximity test, not a theme toggle. Vitals puts the bar in about one in ten median-store orders. Growth Rock shows a complete sticky buy box can add 7.9% desktop orders, while a scroll-to-section control can raise clicks and leave revenue alone. Quote the labeled rung, or run the holdout.
If you built a catalog people will actually sell, list it on feat. and let affiliates keep the buy button in reach.
Product quiz conversion rate benchmarks are a Quiz Denominator Ladder: RevenueHunt 5.5% of completers; ConvertFlow 5.2% of viewers. Not sitewide CVR.
Size guide conversion rate impact is a Size Confidence Ladder: Baymard 83%/87% fail sufficiency; Snipes Fit Finder +3% all-traffic vs a static chart.
Exit-intent popup benchmarks: Omnisend 2025 onExit ~1.8% vs scroll 2.1%; OptiMonk cart-abandon 17.12% is a different job. Not list-growth averages.