Product Quiz Conversion Rate Benchmarks (2026)
Product quiz conversion rate benchmarks are a Quiz Denominator Ladder: RevenueHunt 5.5% of completers; ConvertFlow 5.2% of viewers. Not sitewide CVR.
Checkout conversion benchmarks: Littledata 45% Shopify completion, Baymard 70.22% cart abandonment, mobile gap mostly upstream. Match the clock start.

TL;DR: Checkout conversion rate benchmarks are a clock-start choice. Littledata’s Shopify average checkout completion is 45% once checkout starts (top 20% >59%, top 10% >66%). Baymard’s cart abandonment average is 70.22%, which implies ~29.8% cart-to-order — a longer funnel. Mobile’s big leak is usually checkout reach, not the payment form.
Merchants ask for checkout conversion rate benchmarks hoping for one honest percentage. Search returns “40% to 60%,” Baymard’s ~70% cart abandonment, and Shopify screenshots that never name the denominator. Those are different clocks.
Checkout conversion rate benchmarks matter when you decide whether to rebuild the payment form, fix shipping surprises on the cart, or stop blaming mobile checkout for a leak that happens earlier. This page sits next to product page conversion rate benchmarks, abandoned cart email benchmarks, abandoned checkout email benchmarks, and marketing funnel benchmarks by stage and industry.
Checkout conversion rate benchmarks are published reference points for how often shoppers who hit a defined checkout-start event finish with a paid order, plus nearby meters that people confuse with that rate: cart abandonment and sitewide purchase conversion.
The phrase fails when the clock starts in different places. If the clock starts when a cart exists, you are near Baymard’s abandonment world (~70% leave, ~30% buy). If the clock starts when checkout loads or begin_checkout fires, you are in Littledata’s 45% world. If the clock starts at the session, you are in site CVR near 1.4% on Shopify samples. Community threads mix all three. On r/ShopifyeCommerce, operators ask peers to “share your checkout conversion rate” while replies slide between “50% to 70% once someone hits checkout” and “1% to 3% sitewide” (r/ShopifyeCommerce). Both can be directionally useful. Neither replaces naming your analytics event.
This article owns checkout-started completion and the fork against cart-anchored abandonment. PDP-stage meters live in product page conversion rate benchmarks. Recovery emails after the leak live in abandoned cart and abandoned checkout spokes.
Wrong checkout benchmarks rebuild the wrong surface. Payment UX only sees shoppers who already survived the product page and the cart.
Checkout conversion rate benchmarks work when you name the clock first. Measure checkout-started completion against Littledata. Measure cart-anchored leakage against Baymard. Measure end-to-end money with site CVR. Then split mobile reach from mobile completion. Never flip Baymard’s abandonment rate and call it “checkout conversion.”
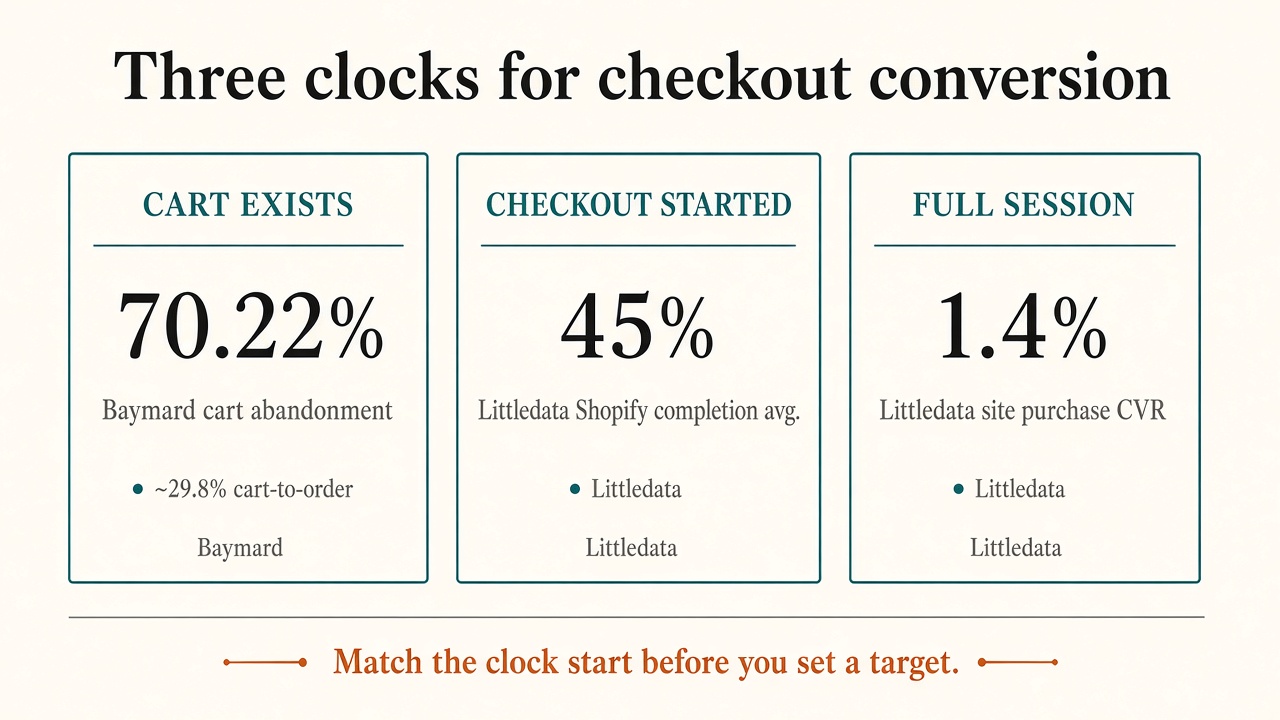
Source: feat. editorial synthesis of Baymard cart abandonment (70.22%) and Littledata Shopify checkout completion (45%) and site CVR (1.4%), 2026. https://www.littledata.io/average-website-performance · https://baymard.com/lists/cart-abandonment-rate
Littledata reports Shopify average checkout completion rate 45%. Above 59% puts you in the best 20% of stores in that panel. Above 66% is best 10%. Mobile averages 44% (best 10% above 64%). Desktop averages 49% (best 10% above 70%) (Littledata).
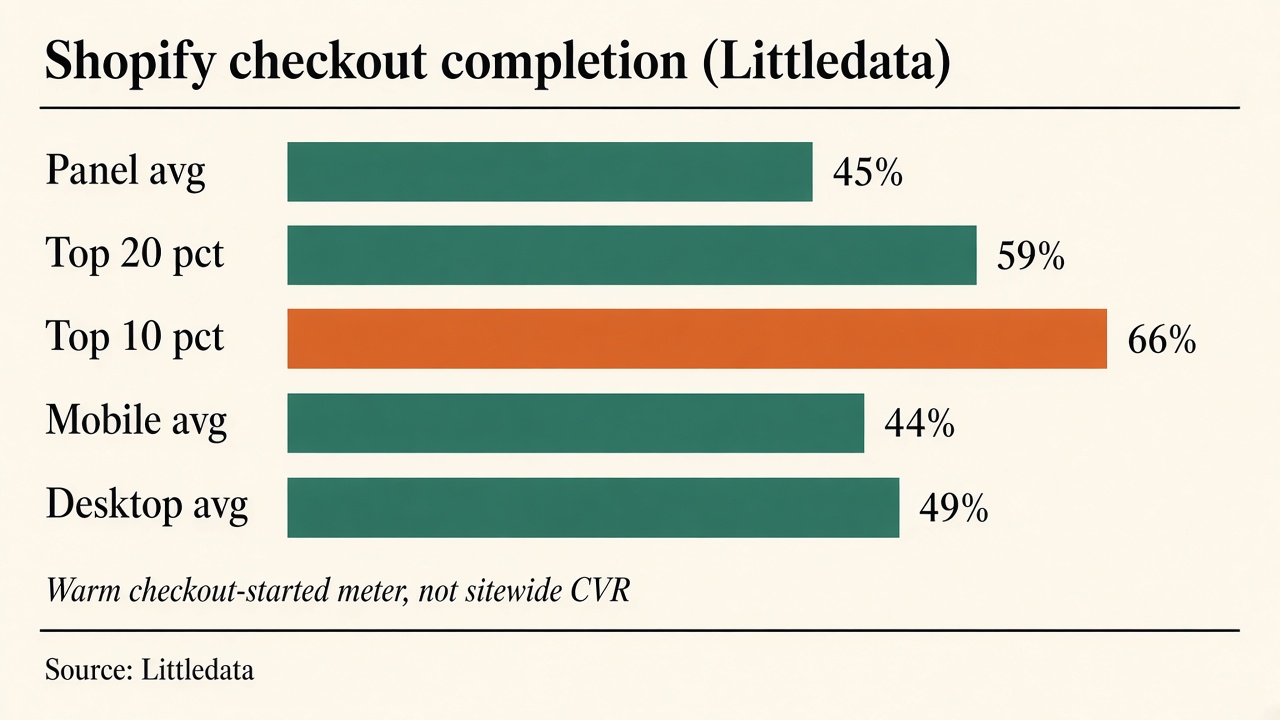
Source: Littledata Average Website Performance (Shopify checkout completion). Accessed 2026-09-28. https://www.littledata.io/average-website-performance
On r/shopify, a merchant with 36 purchases out of 199 checkout sessions (18%) was told that was far below a ~47% Littledata-style average and to inspect shipping, payments, and process friction (r/shopify). That is the right grammar: warm denominator, named completion rate, then cause hunting.
Agency stage samples can run hotter because the traffic is already filtered. ConversionTeam’s audited ecommerce tests put a checkout-stage median near 34.3% on a warm client sample — useful as a labeled CRO-base check, not a Shopify field census (ConversionTeam).
Baymard’s average documented online shopping cart abandonment rate is 70.22%, calculated across 50 studies (list last updated September 22, 2025). Flip it and you get about 29.8% cart-to-order. That is a longer stretch than checkout-started→order, so the percentage lands lower (Baymard).
Baymard’s checkout usability research (272 moderated sessions, 850+ checkout steps, nine quantitative studies totaling 11,777 participants) argues that solvable design issues alone can lift conversion about 35.26% on an average large ecommerce site, even when the tested sites include leading retailers. Their public writing also notes leading-site checkouts still show on the order of 39 improvement areas in benchmark work (Baymard).
Use this meter to justify cart clarity, total-cost honesty, guest checkout, and form reduction. Do not use it as your Shopify “checkout completion” KPI.
Littledata’s Shopify purchase conversion average is 1.4% (mobile 1.2%, desktop 1.9%). Add-to-cart averages 4.6% (Littledata). Littledata does not publish a clean public cart→checkout reach rate on the same page.
You can sketch the middle step only as labeled arithmetic: if session ATC is 4.6%, checkout completion is 45%, and site CVR is 1.4%, then roughly two-thirds of cart sessions must reach checkout for the three to coexist — about 66% to 68% in back-of-envelope form. Treat that as a shape check, not a census. There is no public dataset for a universal cart-to-checkout field benchmark with a declared method. Measure your own add_to_cart → begin_checkout ratio.
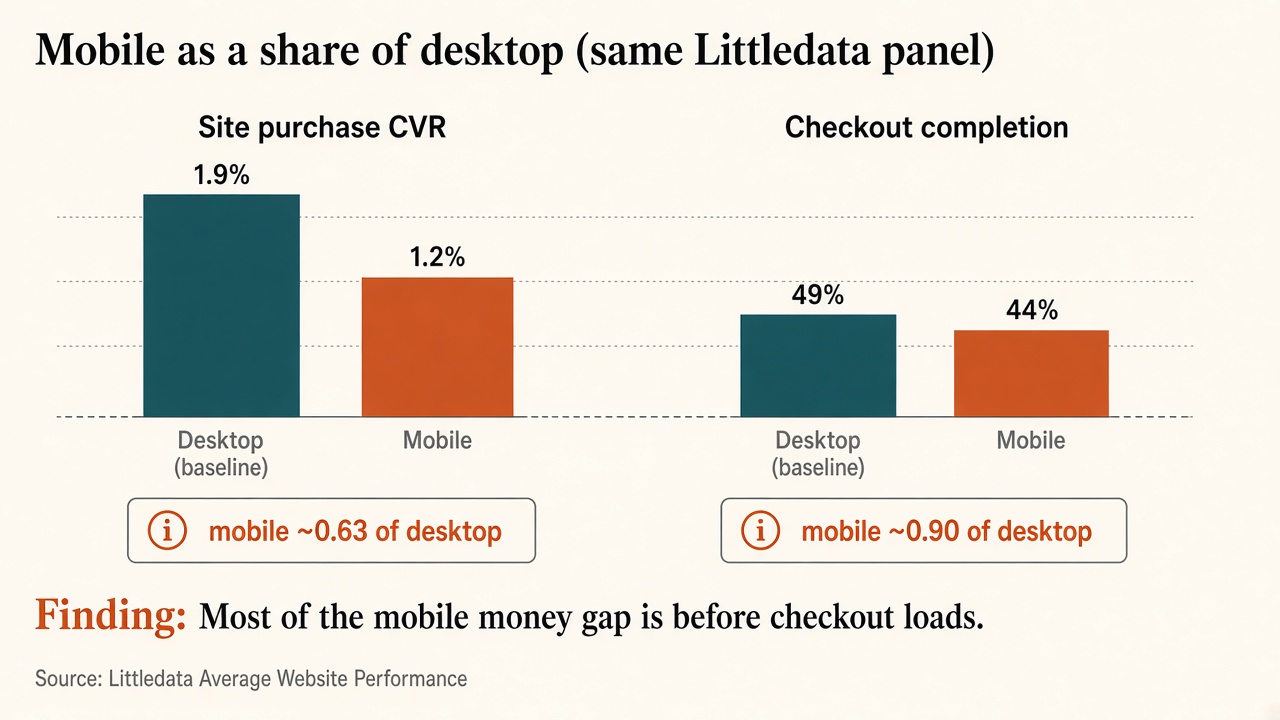
Source: Littledata Average Website Performance device splits for purchase CVR and checkout completion. Accessed 2026-09-28. https://www.littledata.io/average-website-performance
| Meter | Typical published figure | Clock starts | Use it to diagnose |
|---|---|---|---|
| Checkout completion (Littledata Shopify) | 45% avg; >59% top 20%; >66% top 10% | Checkout started | Payment, trust, final shipping surprise, form weight |
| Checkout completion by device | Mobile 44% / desktop 49% | Checkout started | Whether the payment surface itself is the mobile problem |
| Cart abandonment (Baymard) | 70.22% avg (50 studies) | Cart exists | Post-ATC leakage including browse intent and fee shock |
| Implied cart→order | ~29.8% (100% − 70.22%) | Cart exists | Longer-funnel planning; not checkout completion |
| Site purchase CVR (Littledata Shopify) | 1.4% avg; mobile 1.2% / desktop 1.9% | Session | End-to-end monetization |
| Session ATC (Littledata Shopify) | 4.6% avg | Session | Offer + PDP intent before checkout work |
| Form-element load (Baymard) | Avg 23.48 elements vs ideal 12–14 | Checkout UI | Complexity cuts before another redesign sprint |
Search produces a fake disagreement. A cart-anchored ~30% completion, a checkout-started 45% average, and a top-decile 66% are different rows. Glossary pages that publish 25% to 40% mobile ranges without a panel are not interchangeable with Littledata’s 44% / 49% device split. Vertical “typical bands” without a transparent method (common on secondary SEO pages) stay out of the primary table.
GA4 adds another trap. User-based closed funnels and session-based store reports are not the same denominator. Shopify one-page checkout often fires begin_checkout on page load, so bounced loads never enter some reports. Before you panic, reconcile purchase counts to admin orders.
Labeled planning math for 1,000 Shopify-style sessions using Littledata averages (illustrative, not a promise): about 14 orders at 1.4% site CVR. Separately, if 100 sessions start checkout and 45 complete, you are on the panel average for completion — and you still know nothing about the carts that never started checkout. Broader stage grammar sits in marketing funnel benchmarks. Single-offer digital funnels sit in storefront vs landing page.
There is no public dataset in this research for a verified checkout-completion census by Shopify subscription plan, or for Metricuno-style vertical absolute bands with transparent sampling. Secondary posts that invent plan ladders or mash Baymard abandonment into “checkout conversion is 30%” without naming the cart clock are cut. Chart the primary meters: Littledata completion ladder, Baymard abandonment, and the labeled mobile relative-gap comparison.
Benchmarking checkout conversion is a five-step audit: name the clock, pull rates, split device and reach, match a published row, then fix the failing stage only.
add_to_cart, begin_checkout (or checkout page views), and purchases. Reconcile purchases to admin orders.Q: What are good checkout conversion rate benchmarks in 2026? A: For checkout-started completion on Shopify-weighted samples, Littledata’s average is 45%, with top 20% above 59% and top 10% above 66%. Cart-anchored planning still uses Baymard’s 70.22% average abandonment across 50 studies. Match your clock start before you set a target.
Q: What is a good Shopify checkout conversion rate? A: Use Littledata’s Shopify checkout completion ladder: about 45% average, 44% mobile, 49% desktop. Sitewide purchase conversion on the same panel averages 1.4% and is a different KPI. Do not grade a checkout-started rate against a session CVR.
Q: How is cart abandonment different from checkout conversion? A: Cart abandonment (Baymard average 70.22%) starts when a cart exists and includes shoppers who never open checkout. Checkout conversion / completion starts when checkout begins and asks what share finish the order. Flipping 70.22% does not produce Littledata’s 45%.
Q: Why is my mobile checkout conversion lower than desktop? A: On Littledata’s panel, mobile checkout completion (44%) is only modestly behind desktop (49%), while mobile site CVR (1.2%) lags desktop (1.9%) much more. Check checkout reach on mobile — cart drawer, shipping estimate, and express wallets — before you rebuild the payment form first.
Q: Is there an official checkout completion rate by industry or Shopify plan? A: No verified public census by Shopify plan is used as a primary source here, and opaque vertical band tables are refused as field truth. Prefer Littledata’s completion ladder plus your own vertical cohort over unsourced industry grids.
Checkout conversion rate benchmarks help only when you stop hunting one magic percentage. Start the clock on purpose. Use Littledata’s 45% ladder for checkout-started completion. Use Baymard’s 70.22% abandonment for cart-anchored leakage. Split mobile reach from mobile completion. Cut form weight and fee surprises before you celebrate a redesign that never measured the right funnel step.
If you built the product and want affiliates sending buyers into a cleaner co-branded purchase path, start at feat..
Product quiz conversion rate benchmarks are a Quiz Denominator Ladder: RevenueHunt 5.5% of completers; ConvertFlow 5.2% of viewers. Not sitewide CVR.
Size guide conversion rate impact is a Size Confidence Ladder: Baymard 83%/87% fail sufficiency; Snipes Fit Finder +3% all-traffic vs a static chart.
Sticky add to cart conversion lift: Vitals 9.3% of orders involve the bar; Growth Rock +7.9% desktop vs scroll-to-section with no order lift.