Product Quiz Conversion Rate Benchmarks (2026)
Product quiz conversion rate benchmarks are a Quiz Denominator Ladder: RevenueHunt 5.5% of completers; ConvertFlow 5.2% of viewers. Not sitewide CVR.
Product page conversion benchmarks: Baymard PDP UX grades, Littledata 4.6% ATC and 1.4% CVR, Dynamic Yield 6.08% view-based ATC. Match denominators.

TL;DR: Product page conversion rate benchmarks are three meters, not one number. Baymard grades PDP UX (only 48% of desktop and 38% of mobile sites reach decent or good). Littledata puts Shopify session add-to-cart near 4.6% and purchase conversion near 1.4%. Dynamic Yield’s global add-to-cart average is 6.08% on a product-page-view base. Match the denominator before you panic.
Merchants ask for product page conversion rate benchmarks as if the market published one honest percentage. It did not. Agencies quote “2% to 3%.” Dashboards show add-to-cart. UX labs score your PDP as mediocre. Those are different jobs with different denominators.
Product page conversion rate benchmarks matter when you are deciding whether the leak is the offer, the page, or the checkout. This page sits next to marketing funnel benchmarks by stage and industry, abandoned cart email benchmarks, storefront vs landing page for selling digital products, and how to build a digital product funnel.
Product page conversion rate benchmarks are published reference points for how often shoppers who meet a product page take a defined next step: add to cart, begin checkout, or purchase, plus separate UX grades for whether the page is usable enough to earn that step.
The phrase collapses three instruments. First is a UX score, like Baymard’s decent / good / mediocre grades from tens of thousands of manual ratings. That score is not a conversion percentage. Second is an intent meter, almost always add-to-cart rate, which can be session-based (carts ÷ all sessions) or product-view-based (adds after PDP views). Third is a purchase meter, usually site-level orders ÷ sessions, sometimes narrowed to visitors who saw a PDP.
Community threads treat them as one number. On r/shopify, a merchant with 1.34% conversion and 2.55% add-to-cart asked whether paid traffic “should” convert higher, while replies mixed “1% to 2% is normal” with “aim for 6% to 7%+ ATC” (r/shopify). Both can be directionally useful. Neither replaces matching your analytics event to the published denominator.
If you sell digital goods through a single-offer page, you are closer to landing-page grammar than multi-SKU PDP grammar. Unbounce’s Q4 2024 sample still puts median landing-page conversion near 6.6% across about 41,000 pages (Unbounce). That comparison lives in storefront vs landing page. This article owns the multi-SKU product page and session funnel.
Wrong benchmarks burn ad budget and rewrite the wrong page. The PDP is where catalog traffic decides. Checkout only sees survivors.
Product page conversion rate benchmarks work when you name the meter first. Grade usability with Baymard-style scores. Measure intent with add-to-cart on a declared denominator. Measure money with purchase conversion. Then segment device and traffic. Never average a UX grade into a fake absolute PDP CVR.
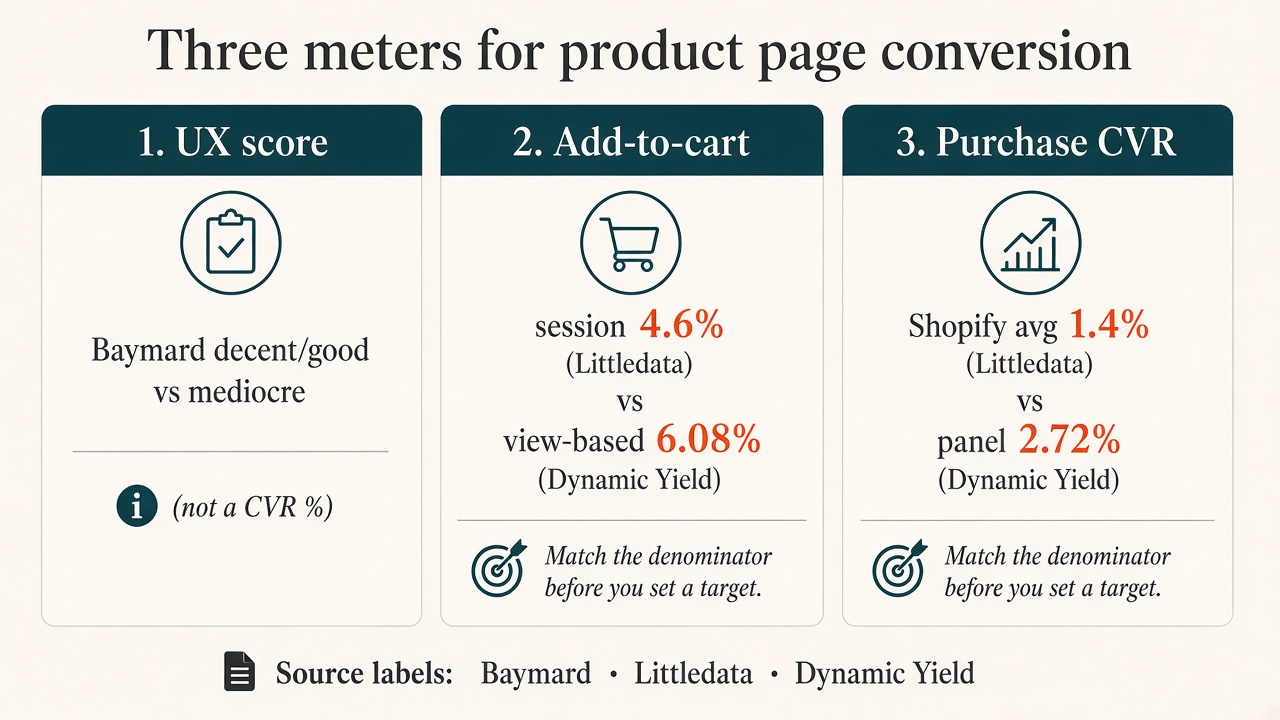
Source: feat. editorial synthesis of Baymard PDP UX grades, Littledata Shopify ATC/CVR, and Dynamic Yield ATC/CVR definitions, 2026. https://baymard.com/research-articles/current-state-ecommerce-product-page-ux
Baymard does not publish “average product page conversion rate is X%” on its PDP UX page. It publishes performance grades. Only 48% of leading US and European desktop ecommerce sites reach decent or good PDP UX. Mobile is 38%. Apps are 36% decent or better. Flip it: 52% desktop, 62% mobile, and 64% of apps are mediocre or worse (Baymard).
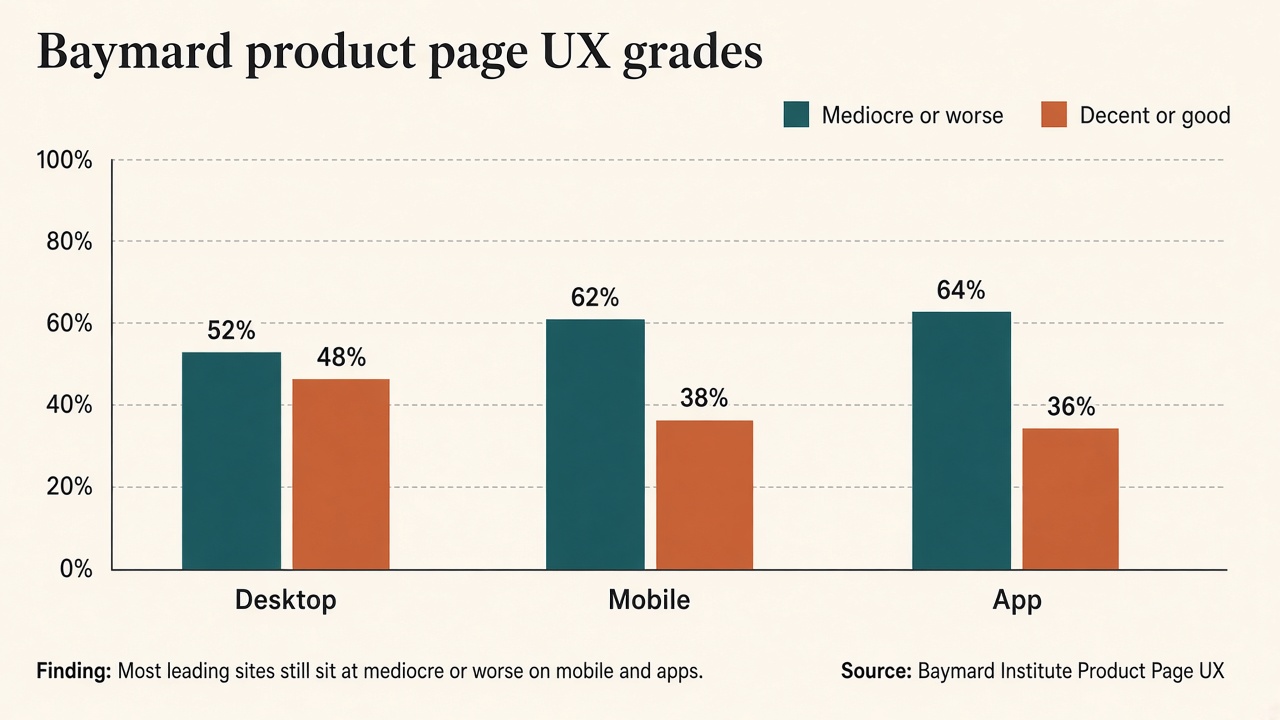
Source: Baymard Institute, Product Page UX benchmark (updated Mar 18, 2026). https://baymard.com/research-articles/current-state-ecommerce-product-page-ux
That is the opportunity map. If your heatmap shows scroll and rage clicks on size selectors, you are probably in the 57% that still hide sizes in menus. If shoppers cannot tell scale, you may be in the 37% without in-scale imagery. These are fixable before you change commission rates or traffic mix.
Littledata reports Shopify average add-to-cart rate 4.6%. Above 7.5% puts you in the best 20% of their Shopify sample. Above 9.6% is best 10%. Fashion averages 5.4%. Food and beverage averages 4.8% (Littledata). Treat that family as session-denominated planning when your GA4 or Shopify funnel divides carts by all sessions.
Dynamic Yield publishes a different instrument. Its ATC definition is the percentage of items added to cart after product page view(s) by visitors. Global average: 6.08%. Twelve-month industry extremes on that page: Beauty & Personal Care 9.56%, Luxury & Jewelry 1.76%. Device split on their ATC page: mobile 6.35%, tablet 6.12%, desktop 5.21% (Dynamic Yield). The hub frames the panel as 200M+ monthly unique users across 400+ brands and 300M+ sessions (Dynamic Yield).
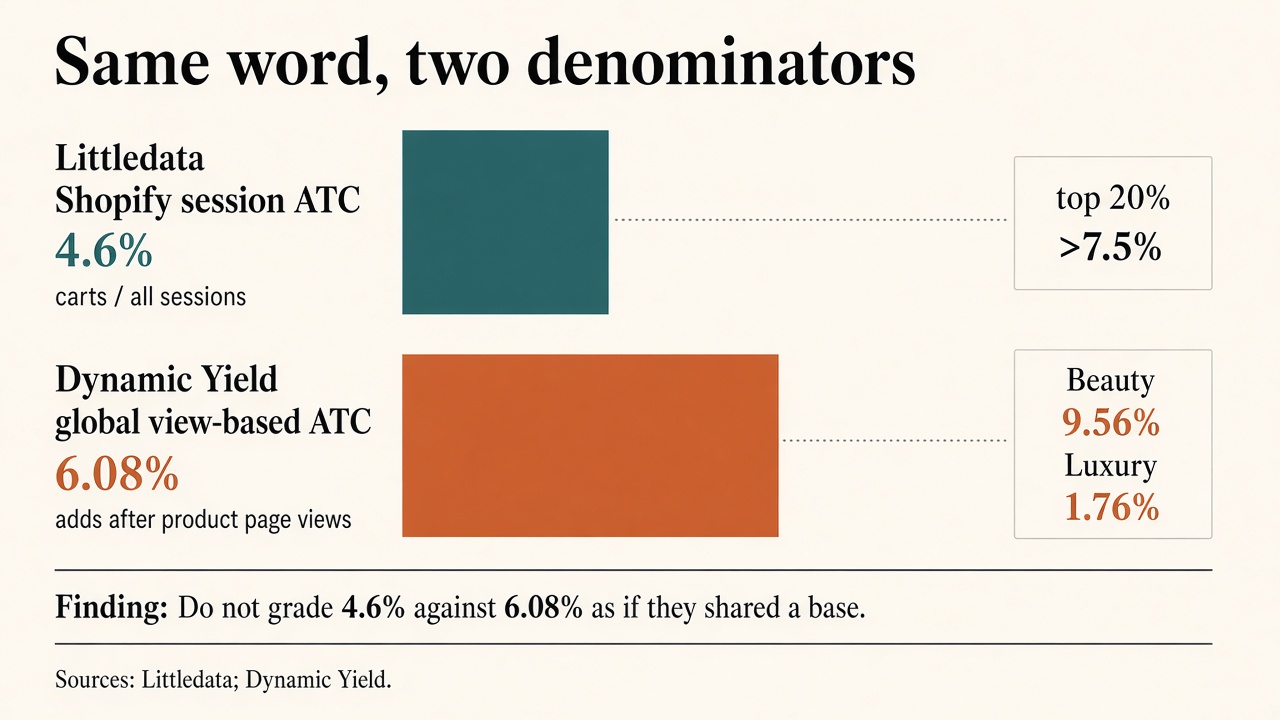
Source: Littledata Average Website Performance; Dynamic Yield add-to-cart benchmarks. Accessed 2026-09-28. https://www.littledata.io/average-website-performance · https://marketing.dynamicyield.com/benchmarks/add-to-cart-rate/
Do not grade a 4.6% session ATC against a 6.08% view-based ATC and declare yourself broken. They are different fractions.
Littledata’s Shopify purchase conversion average is 1.4%. Best 20% clear 3.2%. Best 10% clear 4.7%. Mobile averages 1.2% (best 10% above 3.9%). Desktop averages 1.9% (best 10% above 6.5%) (Littledata).
Dynamic Yield’s global purchase conversion average is 2.72%, with Beauty & Personal Care at 5.39% and Luxury & Jewelry at 0.72% over twelve months (Dynamic Yield).
Agency stage samples run hotter because the denominator is warmer. ConversionTeam’s audited ecommerce A/B-test base ( 168 tests, 23 clients) shows a site-level control median of 3.5%. On product-page tests specifically ( 91 tests, 15 clients), median conversion is 4.7% with a normal range of 2.6% to 7.4%. Cart-page and checkout medians jump to 23.2% and 34.3% because those visitors already committed (ConversionTeam). Label that as an optimized-client sample, not a Shopify field census.
| Meter | Typical published figure | Denominator | Use it to diagnose |
|---|---|---|---|
| Baymard PDP UX grade | 48% desktop / 38% mobile decent or good | Manual UX scores | Clarity, imagery, selectors, save flows |
| Session ATC (Littledata Shopify) | 4.6% avg; >7.5% top 20% | All sessions | Offer fit + PDP intent for whole store traffic |
| View-based ATC (Dynamic Yield) | 6.08% global avg | After product page views | PDP clarity among people who already opened a SKU |
| Site purchase CVR (Littledata Shopify) | 1.4% avg; mobile 1.2% / desktop 1.9% | All sessions | End-to-end monetization |
| Site purchase CVR (Dynamic Yield) | 2.72% global avg | Visitors / panel method | Cross-brand panel check by industry |
| PDP-stage purchase (ConversionTeam sample) | 4.7% median (91 tests) | Product-page test traffic | Warm-stage CRO among testing clients |
| Cart abandonment (Baymard) | 70.22% avg (50 studies) | Carts not completed | Post-ATC leak; email recovery next |
Even a winning PDP feeds a leaky cart. Baymard’s average documented abandonment is 70.22%. About 42% of US shoppers say they were browsing. Among the rest, 40% cite extra costs, 20% slow delivery, 19% trust, 18% forced accounts, 17% checkout length (Baymard). Baymard estimates solvable checkout design issues could lift conversion about 35.26% on an average large ecommerce site. That is checkout work, not another hero image. Stage grammar for broader funnels sits in marketing funnel benchmarks. Digital-product stage builds sit in how to build a digital product funnel.
Labeled planning math for 10,000 Shopify-style sessions using Littledata averages (illustrative, not a promise): about 460 add-to-carts at 4.6%, and about 140 orders at 1.4% purchase CVR. If your ATC is near average but orders are far below 1.4%, chase checkout and abandoned cart recovery before you rebuild the entire PDP.
There is no public dataset in this research for a verified, universal absolute PDP view-to-purchase ladder by vertical (the Metricuno-style apparel 3% to 8% tables). Secondary posts also invent Baymard “mobile PDP converts at 1.4%” purchase rates that do not appear on Baymard’s primary PDP UX page. Cut those. Chart what the primary sources actually publish.
Benchmarking a product page is a five-step audit: pick the meter, pull your own rates, segment, compare to the matching published figure, then fix the stage that fails.
add_to_cart, checkouts, and purchases. Reject week-one data after a theme rewrite.Q: What are good product page conversion rate benchmarks in 2026? A: There is no single good rate. Use Baymard’s PDP UX grades (48% desktop / 38% mobile decent or good), Littledata’s Shopify session ATC near 4.6% and purchase CVR near 1.4%, and Dynamic Yield’s 6.08% view-based ATC. Match your analytics denominator to the source before you set a target.
Q: What is a good product page add to cart rate? A: On a session base, Littledata’s Shopify average is 4.6%, with top 20% above 7.5% and top 10% above 9.6%. On a product-page-view base, Dynamic Yield’s global average is 6.08%. Do not blend those two into one KPI.
Q: Why is my mobile product page conversion lower than desktop? A: Many Shopify samples show the gap: Littledata averages 1.2% mobile vs 1.9% desktop purchase CVR. Baymard also finds worse mobile PDP UX grades (62% mediocre or worse). Fix mobile size selectors, sticky ATC, speed, and above-the-fold clarity before you blame the channel alone.
Q: How do product page benchmarks compare to landing page conversion rates? A: Landing pages are single-offer surfaces. Unbounce’s Q4 2024 median landing-page conversion is about 6.6% across roughly 41,000 pages. Multi-SKU PDPs inherit browse behavior and cart abandonment near Baymard’s 70.22% average. Compare like with like.
Q: Is there an official average PDP conversion rate by niche? A: No verified public census of absolute PDP view-to-purchase rates by niche is used as a primary source here. Dynamic Yield publishes industry ATC and purchase CVR on its own definitions. Vertical absolute PDP tables without method notes should be treated as unverified.
Product page conversion rate benchmarks only help when you stop hunting one magic percentage. Grade the page with Baymard’s UX shares. Measure intent with a declared ATC denominator. Measure money with purchase CVR. Segment mobile. Fix the stage that fails, then let creators sell what the page can close.
If you built the product and want affiliates moving traffic into a cleaner co-branded checkout path, start at feat..
Product quiz conversion rate benchmarks are a Quiz Denominator Ladder: RevenueHunt 5.5% of completers; ConvertFlow 5.2% of viewers. Not sitewide CVR.
Size guide conversion rate impact is a Size Confidence Ladder: Baymard 83%/87% fail sufficiency; Snipes Fit Finder +3% all-traffic vs a static chart.
Sticky add to cart conversion lift: Vitals 9.3% of orders involve the bar; Growth Rock +7.9% desktop vs scroll-to-section with no order lift.