How Much Stock Loss Is Normal on a Creator Campaign
Most marketers see under half of gifted creators post. Plan stock loss as majority silent inventory, then cut ghosts with opt-in and prune rules.
Micro vs macro vs nano influencer ROI: Journal of Marketing evidence on revenue per follower and ROIS, plus when macro still fits awareness goals.

TL;DR: For paid DTC seeding, nano and micro creators beat macros on revenue per follower and return on influencer spend. A 2024 Journal of Marketing study on Instagram endorsements found mean ROIS of 17.85 (nano), 5.98 (micro), and 4.67 (macro). Buy macro for attention. Buy smaller tiers for efficient attributed sales.
Brands still treat follower count like a quality score. That habit burns budget. Micro vs macro vs nano influencer ROI is not a vibes contest. It is a measurement problem: who turns paid posts into tracked revenue after you pay for the post.
If you are allocating a creator budget across tiers, you need three things: a clean definition of each band, primary evidence on efficiency (not recycled engagement percentages), and a clear rule for when awareness still justifies a larger account.
Key takeaways:
Micro vs macro vs nano influencer ROI compares how efficiently paid creator posts turn into attributed revenue across followership tiers, after you account for what you paid for the post.
ROI here means return on influencer spend (ROIS): attributed revenue relative to the cost of the endorsement. It is not vanity reach, and it is not “engagement rate equals ROI.” Follower count is an input. Cash after the campaign is the output.
Practitioner language and research language do not always match. Sprout’s industry bands are the vocabulary most brand teams use: nano under 10K, micro 10K to 100K, macro 100K to 1M (Sprout Social). The Journal of Marketing study splits its sample into followership quartiles inside one fashion program. In Table 2, nano means the bottom quartile (mean 5,034 followers; study cutoff ≤8,496), micro the middle band (mean 22,135), and macro the top quartile (mean 160,740; study cutoff ≥49,845) (JM 2024, Table 2). When you quote those euros, say “study quartile,” not “Sprout band,” unless you have remapped the creators.
This page sits next to affiliate vs influencer marketing. Affiliate vs influencer is about who funds the post versus who funds the outcome. Tier ROI is about which audience size buys efficient outcomes once you are already paying for content.
Wrong tier choice looks like a creative miss. It is usually a unit-economics miss.
Why the comparison earns its own page:
Paid Instagram endorsements in the JM fashion program produced more attributed revenue per follower and higher ROIS at smaller followership tiers because engagement density declines as audiences grow. Macro still buys attention. It loses when you force awareness math through a pure ROIS scorecard.
Beichert and coauthors analyzed 2,808 Instagram sponsored posts from 1,698 influencers for one European DTC fashion firm, tied to 1,881,533 purchases and more than €17 million in revenue. They report three ROI metrics where low-followership targeting outperforms high-followership by an order of magnitude, with field replications (319 paid nano/macro posts) supporting the direction (JM 2024).
| Tier (study quartile) | Mean followers | Revenue / follower | Revenue / reach | Mean ROIS | Follower engagement (pre-post) |
|---|---|---|---|---|---|
| Nano | 5,034 | €0.265 | €0.881 | 17.85 | .147 |
| Micro | 22,135 | €0.080 | €0.305 | 5.98 | .073 |
| Macro | 160,740 | €0.049 | €0.237 | 4.67 | .058 |
Source: Beichert, Bayerl, Goldenberg, and Lanz, Journal of Marketing (2024), Table 2. Study quartile cutoffs: nano ≤8,496 followers; macro ≥49,845. Not identical to Sprout industry bands.
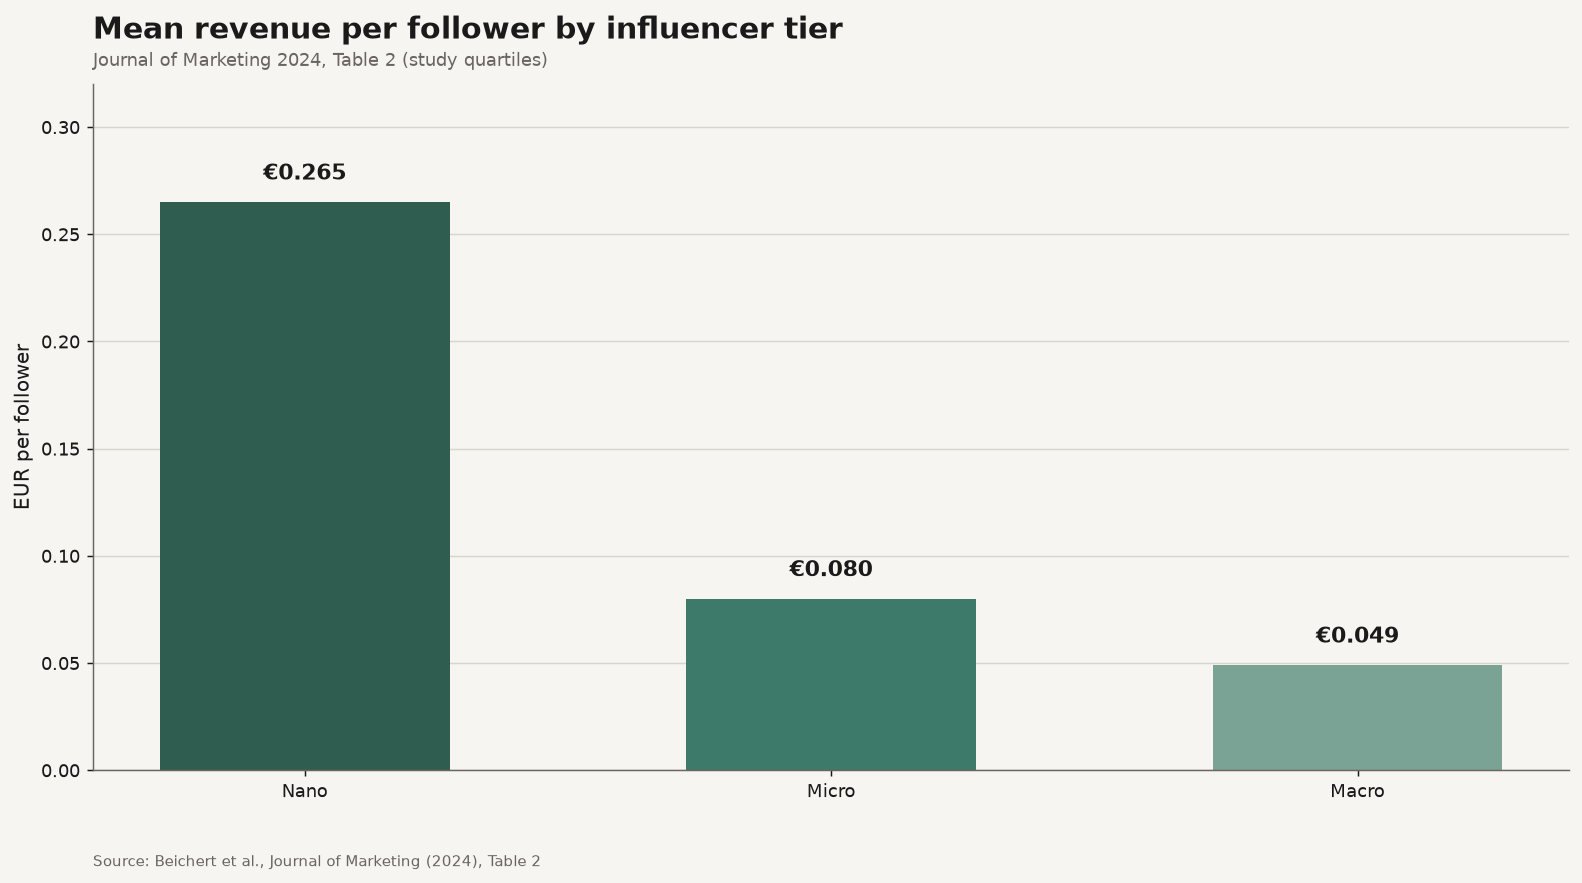
Source: Beichert et al., Journal of Marketing (2024), Table 2. https://doi.org/10.1177/00222429231217471
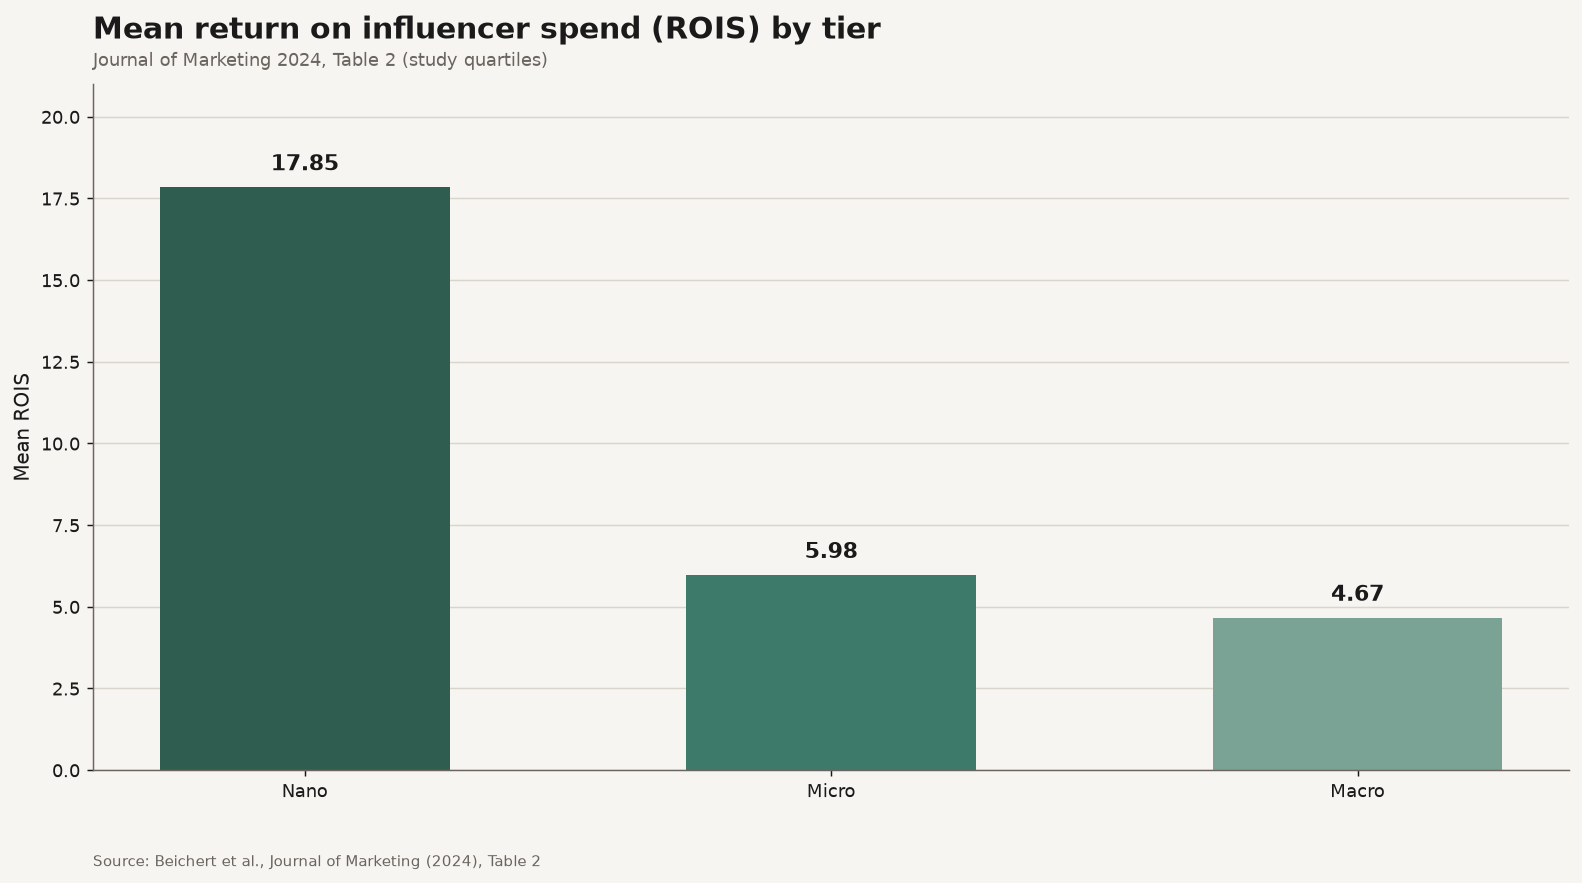
Source: Beichert et al., Journal of Marketing (2024), Table 2. https://doi.org/10.1177/00222429231217471
The mechanism is not mysterious. People in smaller audiences notice and act more often. Table 2 shows influencer engagement (likes and comments relative to followers on the sponsored content itself) falling from .003 (nano) to .001 (micro) to .0001 (macro). The authors report that engagement can explain up to 51% of the direct effect of followers on ROI metrics (JM 2024).
That is the founder translation: you are often buying diluted attention at the top of the follower curve. If your goal is attributed sales per euro spent, dilution hurts. If your goal is category presence in rooms you cannot enter with nanos alone, dilution may be the price of the room.
Map vocabulary before you argue numbers:
| Label | Sprout-style industry band | JM 2024 study definition (this dataset) |
|---|---|---|
| Nano | Under 10K followers | Bottom quartile (mean ~5K; ≤8,496) |
| Micro | 10K to 100K | Middle band (mean ~22K) |
| Macro | 100K to 1M | Top quartile (mean ~161K; ≥49,845) |
| Mega | Over 1M | Not the focus of the ROIS ladder above |
Sprout’s bands are how you brief agencies and creators (Sprout Social). The JM cutoffs are how that paper’s euros were computed. A “micro” at 80K in Sprout language may sit closer to the study’s macro quartile. Do not paste €0.265 onto every creator under 10K without checking how your sample is split.
| Brand job | Prefer | Why | Failure mode |
|---|---|---|---|
| Efficient attributed sales (DTC seeding) | Nano / micro portfolio | Higher revenue per follower and ROIS in JM fashion evidence | Ops overload if you recruit without a template brief |
| Proof content and UGC volume | Many micros | More posts per euro than one macro at the same total budget (operator consensus; not a single public meta-study) | Inconsistent creative quality without QA |
| Category awareness / prestige association | Macro (sometimes mega) | Larger rooms and cultural signal | Judging the buy only on last-click ROIS |
| Hybrid performance (fee + tracked link) | Micro with codes/UTMs | Balances production quality and conversion path (affiliate vs influencer) | Paying twice without a clawback or brief |
| Thin margin physical goods | Nano / micro + tight CPS or gift+commission | Protects margin while testing creators (commission structures) | Celebrity flat fees that ignore contribution margin |
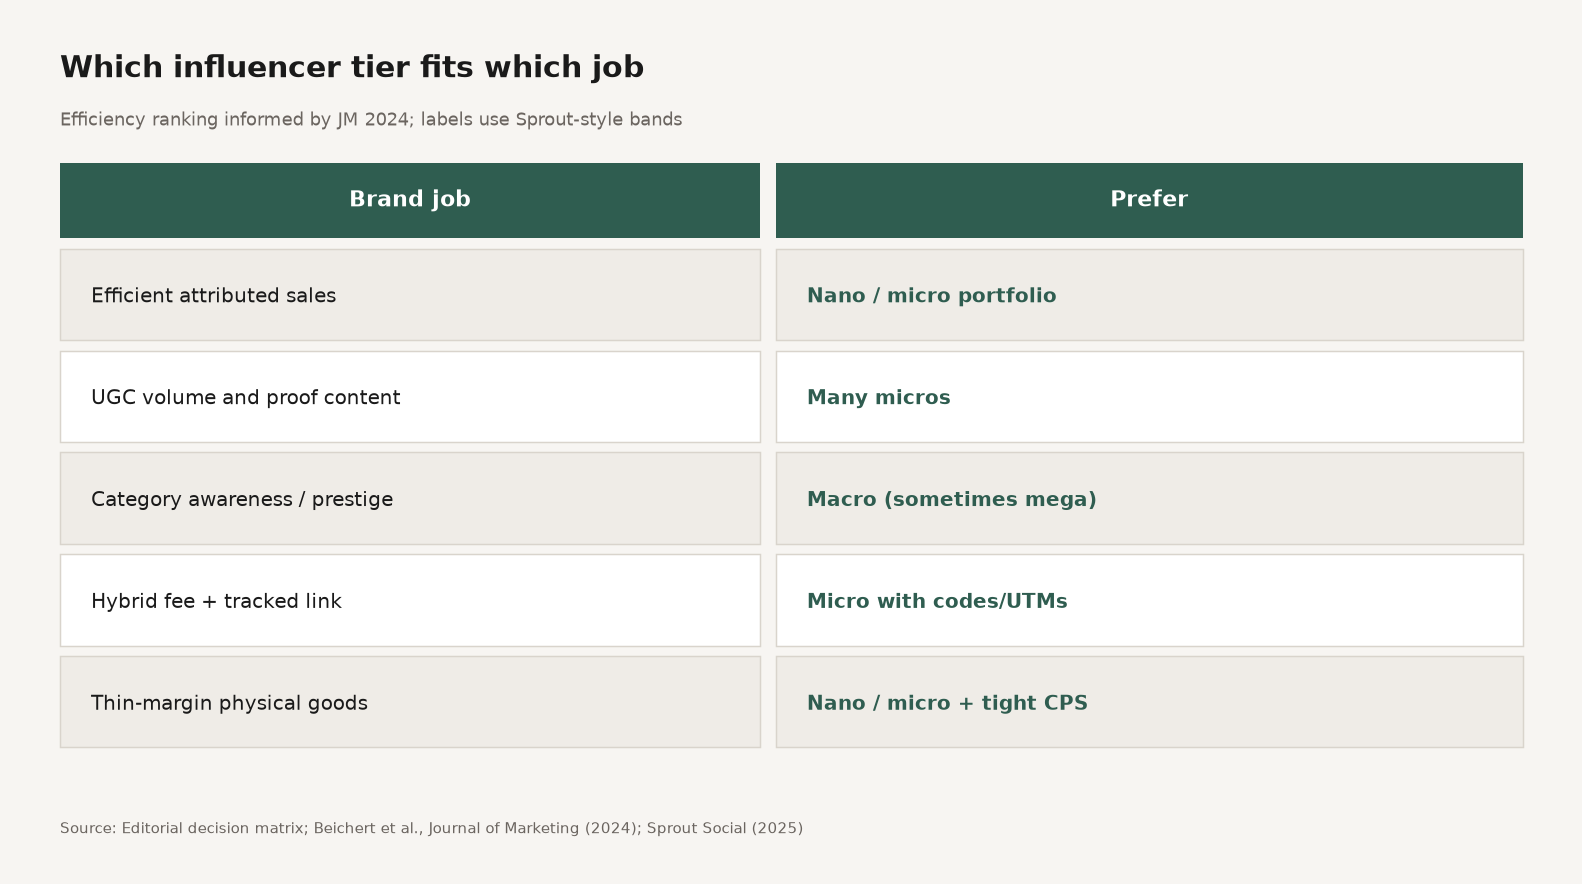
Source: Editorial decision matrix; efficiency ranking informed by Beichert et al., Journal of Marketing (2024). Industry tier labels aligned with Sprout Social (2025).
Common mistakes: equating Sprout bands with JM quartiles; buying one macro because “everyone knows them” without an awareness KPI; running 40 nanos with 40 different briefs; refusing tracking on awareness posts; treating engagement rate as ROIS; inventing a universal “micro always wins” rule when no public dataset covers every category and platform.
Q: Which influencer tier has the best ROI for DTC brands? A: In Beichert et al.'s Journal of Marketing (2024) Instagram study for a European DTC fashion firm, nano creators led on mean ROIS (17.85), then micro (5.98), then macro (4.67). That is strong evidence for performance seeding in that setting. It is not a law for every niche or platform.
Q: What is the difference between nano and micro influencers? A: In practitioner language (Sprout), nano usually means under 10K followers and micro means 10K to 100K. In the JM 2024 study, nano and micro are followership quartiles inside one program (nano mean about 5K; micro mean about 22K). Always state which definition you are using when you quote ROI numbers.
Q: Why do macro influencers often show lower ROIS? A: Engagement density tends to fall as audiences grow. The JM paper reports lower pre-post follower engagement and much lower influencer engagement for macros, and finds engagement can mediate a large share of the follower-to-ROI effect. You pay more for a bigger, thinner room.
Q: When should a brand still hire macro influencers? A: When the job is awareness, prestige association, or cultural presence that smaller accounts cannot buy, and you score the campaign on those metrics (plus optional assisted paths). Do not hire macros for awareness and fire them for last-click ROIS.
Q: Is there a single best tier for every industry? A: No. There is no public dataset that crowns one tier across every category and platform. Use the JM ladder as a prior for paid Instagram DTC seeding, then run your own tracked tests by tier with fixed KPIs and disclosure.
Micro vs macro vs nano influencer ROI collapses to a simple tradeoff once you stop worshiping follower counts. Smaller tiers won on revenue per follower and ROIS in the best primary Instagram DTC evidence we have. Larger tiers still buy attention. Pick the seat that matches the bottleneck, measure with codes, and disclose the relationship. Vanity reach is not a strategy. Attributed efficiency is.
If you are a merchant who wants tracked partners selling through co-branded storefronts instead of a link graveyard, start at https://www.feat.press.
Most marketers see under half of gifted creators post. Plan stock loss as majority silent inventory, then cut ghosts with opt-in and prune rules.
UGC vs influencer marketing is assets vs distribution. Collabstr UGC ~$154 paid; Agentio shows Partnership Ads beat licensed UGC on CTR, CVR, and CPA.
Influencer contract terms explained: usage, exclusivity, whitelisting, kill fees, payment, and FTC disclosure, plus a brand vs creator negotiation matrix.